Login
Login


The Times of Our Lives: A history of longevity
Share

- Details
- Transcript
- Audio
- Downloads
- Extra Reading
Notwithstanding Bible stories, the average human lifespan has reached "three score years and ten" only through spectacular increases in the past two centuries, and only in the richer half of the world. Among the 60 million people who die each year, 10 million are children under five, mostly in poor countries. What do they die of, and why? Where in the world is health getting better, and where is it getting worse?
Download Transcript
The Times of Our Lives: A history of longevity
Christopher Dye, Gresham Professor of Physic
Slide 1.
When I was born in 1956 I was expecting to live to age 68 and die in year 2024. I've done 50 years, so presumably I have 18 left? Happily not. When I got my Bachelors degree in Biology at age 22, I was in fact still expecting to live a further 50 years. In 22 years I had lost only 18 years of my life expectancy from birth. I had gained an extra 4 years from somewhere. Now in 2006, I'm 50, and yet I have still have 35 years left. Amazing! When my father was born in 1924, he could expect to live only 58 years. And yet, in 2006, he is alive and well at 82.
Slide 2.
You might already be drawing the conclusion that I'm obsessed about my own life and death. My purpose, of course, is to raise some general questions by example, under the heading of "Life and Death in the New Millennium". The specific questions I'm going to discuss in this lecture are as follows. Where were the first improvements in health and longevity? Why did life span double in Britain after 1800? What were the underlying population processes? Which were the key interventions? Are we now reaching maximum life expectancy? Lastly, I want to know how the lessons of the industrial revolution in Britain and Europe have been and are being applied elsewhere: are "developing" countries actually developing? My general aim in this series of lectures is to try to understand what factors limit health and longevity in the world today.
Slide 3.
Before beginning to prepare these lectures, I sought inspiration and guidance from some of the characters and incidents in the history of Gresham College, once regarded as "The Third Universitie of England".1 As the 35th Professor of Physic, 410 years after the first, I have some impressive acts to follow. The first professor, Matthew Gwinne, was a royal physician as well as a playwright. Guidance on the practice of physic come from numerous sources, and some of it is presented on this slide. I was struck by WH Thomson's 1904 lecture on "Nature and Immortality", which earned him the professorship of divinity. You may think that immortality is properly the territory of divinity, but in fact it is a legitimate question in biology too – related of course to longevity.
Slide 4.
With that guidance, here are my six terms of engagement. (1) I am going to try to give you an overview of human health in the context of environment and evolution. (2) Seeing is believing. I assume that you will not believe me unless I show you the evidence. (3) I will try to distinguish what is known from what is unknown. (4) I will try to describe not simply what happens, but also why it happens. (5) I will freely ask questions to which I do not know the answer, provided they are questions that are answerable in principle by recognized scientific methods. That is one distinction between science and divinity. (6) I will focus on populations (epidemiology) rather than individuals (clinical).
Slide 5.
(Q1) Where were the first major improvements in health and longevity?
Slide 6.
One of the most remarkable facts in human biology is the massive increase in life expectancy in the industrialized world between 1800 and 1950. What is extraordinary is the plasticity of our life spans - the potential for such rapid change. Here's a reconstruction of what happened in England. Data are sketchy for the 14th and 15th centuries, but life expectancy from birth was about 30 years. The data improved from the 16th century onwards, and a key source is Wrigley & Schofield's in-depth analysis of the population history of England. There were ups and downs between about 1550 and 1800, but life expectancy remained trapped between 30 and 40 years. It wasn't until the early 1800s that life spans began steadily to increase, reaching 70 in England by around 1950. The only marked periods of decline were the years of the two world wars. If we can explain this remarkable increase in life expectancy, then we might be able to repeat it elsewhere – in the so-called developing world.
Slide 7.
What do Japanese women and hunter-gatherers have in common? Very little, when it comes to life expectancy.
Slide 8.
Another way to look at the change in life spans is via survivorship curves. Imagine a cohort of 100 babies all born in the same year and ask how many of them survive to different ages. When humans made their living as hunter-gatherers, life was definitely short by today's standards, and it may often have been nasty and brutish too. Taking the average for 5 groups of hunter-gatherers living today – including the Hadza of Tanzania, the Ache of Paraguay, and the Hiwi of Venezuela – only half of the children born are still alive by age 10. These circumstances are now rare, but they were the circumstances of humanity for most of the period over which we have evolved. The evolutionary process yielded humans that had an extraordinary potential for longevity, which has been exploited only in the past 200 years of our 1 million+ year history. That potential has now yielded at the pinnacle, Japanese women, who have a survival curve that is the mirror image of that for hunter-gatherers.
Slide 9.
Is this plasticity of life span uniquely human? It might be. Wild chimpanzees, for example, look rather like human hunter-gatherers. In captivity, they do better, but they don't look like Japanese women. Is there a real difference here, and if so why? I will leave that question for a later lecture.
Slide 10.
(Q2) For now, I'm going to focus on the population processes caused life expectancy to double in just 150 years. I'm going to address this question in two ways. First, I want to look at the underlying population processes – the changing balance between births and deaths. Second, I want to explore the inventions and interventions that caused deaths to fall and births to increase.
Slide 11.
This slide shows the fundamental equation of population biology. Population change in a given time period (on the left) is equal to births minus deaths plus immigrants minus emigrants (on the right). Here I'm mainly concerned with deaths, and the flip side longevity, but it's important to see how deaths interact with births.
Slide 12.
Now, the recipe for long life is, in the words of the Mercer-Arlen song, to eliminate the negative, accentuate the positive (and don't mess with mister in-between). But it's a bit more subtle than that.
Slide 13.
The subtlety comes in the form of feedback loops. My theory is that the rapid increase in life span in England was facilitated by the switch from negative to positive feedback.
Slide 14.
When we see long periods of stasis or steadiness in series of data like this we think of regulation, or negative feedback. When life expectancy goes up, there is some force that brings it back down again. When it goes down, there is some force that brings it back up again.
Slide 15.
The best-known exponent of regulation or negative feedback was Thomas Robert Malthus. At the end of the 18th century he suggested that human populations would be regulated by their food supply. The problem, as he proposed it, was that populations grow geometrically or multiplicatively (1,2,4,8,16 etc), but the food supply increases only arithmetically or additively (1,2,3,4 etc). So the population outruns the food supply. This is now clearly a very simplistic view, but there are numerous ways in which the basic idea of feedback could take effect.
Slide 16.
We are constrained by having few historical data, but here is one possibility. Comparing London parishes in the 16th and 17th centuries, Landers found that child mortality was higher in poorer households. The implication – and that's about a strongly as we can express it – is that having more children on fewer resources will lead to a higher risk of death for each child. That would be negative feedback.
Slide 17.
To get rapid increase in life expectancy, we have to eliminate the negative and exploit the positive feedback.
Slide 18.
That is, rapid increases of the kind seen between 1800 and 1950 in England are characteristic of positive feedback loops, of which there were many kinds, affecting health, the economy, lifestyles and other things, from the start of the industrial revolution onwards.
Slide 19.
I'm going to explore one kind of positive feedback loop, which comes from the interactions between different causes of ill health. First, a note about how the causes of ill health are usually expressed. In English parishes, beginning in 1538, every burial required completion of a document that was the precursor of the modern death certificate. John Graunt published his analyses of Natural and Political Observations … on the Bills of Mortality in 1662, and that work became the founding classic of the modern sciences of vital statistics and epidemiology.2
Slide 20.
In Graunt's list of deaths there are some clear-cut (so to speak) causes (e.g. execution), but some are bound to be the result of interacting conditions – chrisomes (neonatal mortality), flux (dysentery), teeth (death in teething).
Slide 21.
Ever since, death statistics have listed one principal cause of death. And yet the death certificate allows immediate, antecedent and other contributory causes. For example, a man dies from a rupture of the heart after an acute myocardial infarction (an area of heart muscle dies or is permanently damaged) following chronic insufficiency of the blood supply to the heart. He also suffered from diabetes and was a heavy smoker. The immediate cause of death is "rupture of myocardium." The intermediate cause is "acute myocardial infarction." The underlying cause is "chronic ischemic heart disease." On part two of the certificate, "diabetes" and "smoking" are listed as significant contributing conditions.
Slide 22.
Likewise, in the malnutrition-infection complex, there are powerful interactions between infection and nutrition.3,4 Diarrhoea leads to poor food absorption, which leads to lower resistance to infection, which leads to more diarrhoea. This can be a downward spiral (anticlockwise), or converted to an upward spiral (clockwise).
Slide 23.
(Q3) So what interventions could help to generate positive feedback, and when did they become available?5 They come under three main headings, and in order they were…
Slide 24.
First, the long-term improvement in agriculture and nutrition. Prior to the 17th century in England, there was estimated to be only 20-30% excess in food production, with a similar fluctuation in yield. So, in some years, farming communities lived right on the edge. As productivity increased from the 17th century onwards, to generate safe margins in yield, famines became fewer, and there were no famines at all in 20th century Britain.
Slide 25.
Second, came the "sanitation revolution", the understanding that public health measures could prevent and control outbreaks of diseases, even science had no idea at the time what agents caused these outbreaks. John Snow (On The Mode of Communication of Cholera 1855) and Edwin Chadwick (Sanitary Condition of the Labouring Population of Great Britain 1842) were pioneers of sanitary public health in the 19th century.
Slide 26.
Third came microbiology, starting in the 17th century with the development of lenses and microscopes, that aided diagnosis. That includes the work of the "ingenious and knowing" Robert Hook (once Gresham Professor of Geometry). Inoculation has been carried out for centuries as a preventive measure, but the science of vaccination did not flourish until the late 19th century. The science of chemotherapy came later still, with the antibiotic era in the first half and middle of the 20th century.
Slide 27.
(Q4) These processes and interventions led to a doubling of life span in England in 150 years, between 1800 and 1950,. Where are we going from here? Although some believe that there must be an upper limit to life span, there is not much sign of that yet.
Slide 28.
The work of Jim Oeppen has shown that, if you chart the growth in life expectancy of the countries that have the highest average life span, there is no sign of any deceleration.6 The maximum average life span have been growing by one year in every 4 years, since the middle of the 19th century. We tend to think that it can't get much better but, historically, there has been a collective failure of imagination about longevity. The green triangles on this graph show predictions of the maximum life expectancy, positioned in the year in which the prediction was made. Each of these predictions has been exceeded, on average, within 5 years of being made.
Slide 29.
As for my own predicament, my life expectancy is increasing as the years go by, but it is not, alas, increasing faster than passing time. The statistics suggest that I am on a collision course with mortality in 2041, and that I will die aged 85. I'm going to come back to these matters of longevity in the western world in a later lecture, but I want, for the remainder of this discussion, to think about what is happening elsewhere in the world.
Slide 30.
(Q5) Are so-called "developing" countries actually developing? In this final section, I want to consider how the supposedly developing countries of the world have been able to make progress, based on all that has been learnt over the past two centuries. Despite the massive potential for rapidly improving health and life span, the evidence shows that fortunes have been mixed.
Slide 31.
In the words of novelist William Gibson…
Slide 32.
This is the big picture of human population.7-9 You probably know that there are about 6 billion people in the world today. The numbers are large. What does 6 bn actually mean, apart from a lot of Chinese people on bicycles (and, increasingly, in cars)? One way to look at it is in terms of the 9bn ha of ecologically productive land. With 6bn people that is 1.5 ha/person. Some estimates suggest we need 2.5 – 3 ha each. In that sense, there are already too many people. Rich people (USA) use about 10ha each, poor people (Indian subcontinent) only 1ha. We can't all live like Americans. Is there a negative feedback mechanism here? You may not know how many people are born (about 133m) and die (about 60m). That's about 2 babies born each year for every 100 people alive, while 1 person dies. That leaves a net increase of more than 70m people annually, or just over 1 extra person for every 100 alive. While the human population is still growing, you should know that the growth is slowing down: the maximum the number of people added to pool of humanity was 85 million, and that was back in the 1980s.
Slide 33.
One way to compare progress in improving health around the world is to align all the countries on Oeppen's line of growth in maximum life expectancy. So western European countries like France are at the top right hand end of the line. But around a quarter of all countries in the world have life expectancies that were typical of 19th century, and even 18th century, England.
Slide 34.
And while people in England have expected to live beyond 70 years for half a century, only half of the world's countries have reached that mark, with the poorest performers, notably in Africa, tailing off badly to the bottom right.
Slide 35.
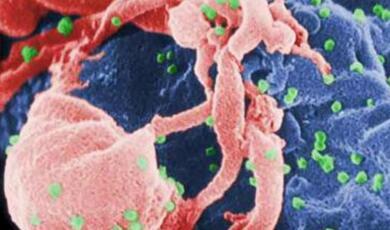
The survival curves of various countries give us some insight into why this is. At the high end of life expectancy, the UK is like Japan. Russia used to be more like the UK, but has suffered huge additional mortality since the collapse of the Soviet Union, especially among middle age men. India dies better than Russia in middle age, but still suffers from relatively high child mortality. The most striking feature of Zimbabwe in recent history has been the extraordinary loss of life in middle age, due to HIV/AIDS. Sierra Leone has not been so heavily affected by AIDS, but suffers appalling high child mortality.
Slide 36.
Nowadays, about 60 million people die every year. What do they die of and where? How are the deaths divided between communicable, non-communicable diseases and injuries? And between rich and poor countries?
Slide 37.
Here's the crude summary. In terms of the number of deaths per head of population, people in low-middle income countries are still terribly afflicted by infectious or communicable diseases. Much more so than in high-income countries. People in high-income countries die largely of non-communicable diseases. But the burden of non-communicable disease is high in low-middle income countries too. So they have a double burden to cope with. Death from injuries looks small on this picture, but fatal injuries are growing in the poorest countries. About a third of fatal injuries are from road-traffic accidents where, for example, safety measures have not kept pace with growth in the numbers of cars on roads in big cities. Many of the victims of injuries are children.
Slide 38.
Among the 60 million deaths, 10 million are children.10 They die mostly in Africa and in the Indian sub-continent (red dots in the background to this slide), and they die mostly of conditions that cost very little to prevent. Four million die within a month of birth. Another 4 million or so from pneumonia and diarrhoea. And underpinning many of these immediate causes of death is malnutrition.
Slide 39.
We often lament the apparent lack of progress in the so-called developing countries, and the statistics I've show you will reinforce that view. But while we contemplate these numbers we have to keep in mind the time scale on which we set targets today. Targets are usually governed by 5-10 year political horizons, as compared with the progress that followed the industrial revolution over more than 100 years in England. With this perspective, there is some good news. On average, life expectancy in low- and middle-income countries has been catching up. Between 1960 and 1990 you can see the convergence, and that convergence has continued since.
Slide 40.
We can use the historical increases in longevity in England as a yardstick of progress. In England, the increase in life expectancy reached a maximum of about 4 years per decade in first half of the 20th century. That has easily been matched by developing countries on average, and exceeded by many, notably China. The inference is that, with the application of the powerful technology that has been developed over the past 200 years, huge health gains can be made quickly (and cheaply). Life expectancy in sub-Saharan Africa was, between 1960 and 1980, growing faster than ever seen in Britain, but has been reversed by the spread of HIV/AIDS.
Slide 41.
If "every generation needs a revolution" (Jefferson), then some countries have got it through health. Given the technology, the health revolution is there for the taking.
Slide 42.
When Chou-en Lai was asked what he thought was the impact of the French revolution, his answer was either very evasive or very prescient. I'll assume that latter. The accumulation of wisdom that led to the increase of longevity during the industrial revolution – which seemed rapid when viewed across all of history – has allowed much faster improvements in health as technology has become cheaper in a now highly-connected world.
Slide 43.
Phenomenonally, China achieved an increase in life expectancy of about 25 years in the 25-year period from 1950 to 1975 (Mao Tse Tung died 1976). This is close to the "line of immortality" that I showed you earlier. Of course it could not be maintained, and it has not been maintained since 1975.
Slide 44.
In summary, the agricultural and industrial revolutions that took place from about 1700 onwards, first in England and then elsewhere in Europe, North America and beyond, led to a revolution in health that moved mankind from control by environment, and set us on a path to control by "genes". The average life span in England doubled in 150 years, most spectacularly in the first half of the 20th century. Once regulation by births and deaths had been overcome, the growth in life expectancy was rapid, exploiting many positive feedback loops that had both indirect and direct effects on health. Direct were, more or less in sequence, food production (nutrition), public health (sanitation) and microbiology (diagnostics, drugs, vaccines). The direct effects were powerful partly because they relieved a complex of interacting causes of illness (e.g. the infection-malnutrition complex). The indirect effects were the building of institutions, capital, labour and technology, linked to social (especially) and economic (weakly) development.
Slide 45.
Today people in "developing" countries still have life spans that range between those of hunter-gatherers and people living in industrialized countries. In the past 50 years, countries with pronounced social and economic growth, taking advantage of the technology already at hand, have far outpaced England during the first half of the 20th century, China being a prominent example. In the countries that have lagged behind, life spans are limited by old problems (age-old infection-malnutrition complex) and new ones (lifestyle diseases, new infections especially AIDS). These problems, in various combinations, have slowed health gains in some places in the past 20 years, and in some places they have been reversed.
Slide 46.
Research in biology, medicine and public health has created cheap and effective technology and procedures that can improve health in developing countries now – if they can be applied. In trying to help poor countries escape from poverty, the advice from the rich world typically places strong emphasis on technology. And yet technology may not be the principal limiting factor; good drugs and vaccines can only partly compensate for other deficiencies. Specific health interventions (e.g. malaria control) need strong public health systems, and public health systems need the institutions (democracy, governance, law, infrastructure), capital (good public health programmes, based on simple technology, cost no more than a few percent of GDP), and labour (broad ranging skills at all levels) that are characteristic of strong programmes of social development.
In the next of this series of lectures, I'm going to focus on infectious diseases: the role they have played in illness and death through history, how they are distributed around the world today, and what threats we are likely to face in the future. In 1969, US Surgeon General suggested that we can close the book of infectious diseases. He was definitely wrong in 1969; will he still be wrong in 2069?
Selected references
1. Chartres R, Vermont D. A Brief History of Gresham College 1497-1997. London: Gresham College, 1997.
2. Graunt J. Observations on... the Bills of Mortality (www.ac.wwu.edu/~stephan/Graunt/graunt.html), 1662.
3. Wrigley EA, Schofield RS. The Population History of England 1541-1871 Cambridge: Cambridge University Press, 1989.
4. Wilmoth JR, Shkolnikov V. The Human Mortality Database (www.mortality.org): University of California, Berkeley, 2006.
5. Easterlin RA. How beneficient is the market? A look at the modern history of mortality. European Review of Economic History 1999;3:257-294.
6. Oeppen J, Vaupel JW. Demography. Broken limits to life expectancy.Science 2002;296:1029-1031.
7. Cohen JE. How Many People Can the Earth Support? New York: W.W. Norton & Company, 1995.
8. Lopez AD, Mathers CD, Ezzati M, Jamison DT, Murray CJL, eds. Global burden of Disease and Risk Factors. New York: Oxford University Press/World Bank, 2006.
9. Jamison DT, Breman JG, Measham AR, et al., eds. Priorities in Health (www.dcp2.org). New York: Oxford University Press/World Bank, 2006.
10. Black RE, Morris SS, Bryce J. Where and why are 10 million children dying every year? Lancet 2003;361:2226-2234.
© Professor Christopher Dye, Gresham College, 28 September 2006

This event was on Thu, 28 Sep 2006

Support Gresham
Gresham College has offered an outstanding education to the public free of charge for over 400 years. Today, Gresham plays an important role in fostering a love of learning and a greater understanding of ourselves and the world around us. Your donation will help to widen our reach and to broaden our audience, allowing more people to benefit from a high-quality education from some of the brightest minds.