The modern theory of probability is considered to have begun in 1654 with an exchange of letters between Blaise Pascal and Pierre de Fermat, and has developed since then into the discipline which examines uncertain processes. For example, although on tossing a coin you have no idea whether you will obtain heads or tails we know that if you keep doing it then in the long run it is very likely that the proportion of heads will be close to a half. The lecture will discuss this and other examples of random processes e.g. random walks and Brownian motion.
18 FEBRUARY 2014
PROBABILITY AND ITS LIMITS
PROFESSOR RAYMOND FLOOD
Slide: Title slide
Welcome to the fifth of my lectures this academic year and thank you for coming along.
This year I am taking as my theme some examples of fundamental concepts of mathematics and how they have evolved.
Today I will be talking about probability. The idea of probability or randomness or chance is very old and goes back centuries and its study started with investigating gambling and games of chance.
However its rigorous mathematical formulation only happened just over 80 years ago in 1933 and was due to the Russian mathematician Andrey Kolmogorov.
Probability is a subject that has many applications in science, engineering, finance and the social sciences and it underlies the subjects of statistics and quantum mechanics.
I want to illustrate some of Probability’s key features and in particular some of the properties of what happens in the long run.
Let me give you an overview of what I will be talking about.
Slide: Overview of the lecture
Sample spaces and probability
First of all I will define and give some examples of key terms in probability. I am going to approach these using situations in which the outcomes are equally likely such as tossing a coin or rolling a dice. To illustrate the ideas we will calculate the probability that there are at least two people in this room who have the same birthday.
Fermat and Pascal
This equally likely approach was the basis of Pierre de Fermat and Blaise Pascal’s consideration of some gambling problems. It is often said that this work by Fermat and Pascal was the beginning of modern probability theory. I will look at one of these problems – that of the interrupted game. For example you and I toss a coin until one of us wins four times. But the game is interrupted when you have won twice and me once. The question is how should the prize be allocated between us?
Taking it to the limit
There are two frequently taken approaches to probability. The first is the equally likely approach that I will have introduced and which is based on symmetry. The other is based on frequency and if a fair coin is tossed repeatedly it will in the long run give the same proportion of heads and tails. We will see their relationship in this section.
Random walks and bad luck
Random processes have been used in many fields: ecology, economics, psychology, computer science, physics, chemistry, and biology. It is a process where what happens next is not determined but depends on probabilities such as the result you get if you keep tossing coins. Another example is if there is slow queuing traffic on the motorway and when you choose which lane to stay in, it always seems to be the wrong choice and the other lanes go faster. We will see that this bad luck is to be expected!
Einstein and Brownian motion
In 1905 Albert Einstein published four papers of ground-breaking importance. One of them was on Brownian motion which is a random process noticed by the Scottish botanist Robert Brown. Brown noticed that a small particle in a liquid undergoes erratic motion which is caused by the molecules of the liquid colliding with it. Einstein was able to make quantitative predictions about the erratic movement and we will see that a good way of thinking about Brownian motion is in terms of random walks.
Slide: Experiments and Sample spaces
Probability is used for situations in which the outcomes happen randomly, for example the outcome of tossing a coin or the length of time between two successive earthquakes in a particular earthquake zone.
The standard terminology in probability for situations in which the outcomes happen randomly is to call them experiments and the set of all possible outcomes the sample space.
Some examples are:
Experiment: Toss a coin
Sample space = {Heads, Tails}
Experiment: Keep tossing a coin until you obtain Heads. Note the number of tosses required.
Sample space = {1, 2, 3, 4, 5 …}
Experiment: Measure the time between two successive earthquakes.
Sample space = set of positive real numbers
We are only going to deal with sample spaces with a finite number of outcomes and we are going to assign a non-negative number to each outcome in the sample space. We will think of these numbers as giving the probability that the outcome happens or how likely the outcome is.
Slide: Equally likely
In many common examples each outcome in the sample space is assigned the same number so that each outcome has the same probability.
By convention these probabilities are chosen so that they add up to 1.
Example: Toss a coin twice
Sample space = {HH, HT, TH, TT}
There are four outcomes so assign the same probability to each of these four outcomes and make it so that their sum is 1. This assigns a probability of ¼ to each of them.
Slide: Equally likely with events
An event is the name for a collection of outcomes.
In this table I have used a spreadsheet to do the calculation for various values of n. The answer for n = 4 is still 0.016, for n =16 it is 0.284 but for n= 23 it is more than a half. So in a random group of 23 people it is better than a 50/50 chance that two have a common birthday.
The probability increases very quickly with n. For n = 32 it is 0.753, for n=40 it is nearly 0.9 and for n= 56 it is 0.988.
For n = 100 then the probability is 0.9999997
So in 10 million lecture theatres each with 100 people we would expect three lecture theatres only to have no people with a shared birthday.
Slide: Founders of Modern Probability
The modern theory of probability is frequently considered to begin with correspondence between the two French mathematicians Pierre de Fermat and Blaise Pascal. This is not what they are now best known for so before moving to their work on probability I will briefly describe their other perhaps better known achievements.
Fermat is mainly remembered for his contributions to number theory, even though he often stated his results without proof and did not publish his conclusions. Perhaps his most famous contribution to number theory was Fermat’s Last Theorem which was only proved by Andrew Wiles in the mid-1990s.
Blaise Pascal wrote an influential treatise on the array of numbers now known as ‘Pascal’s triangle’. Although it was known to Islamic, Indian and Chinese mathematicians many centuries earlier it is justifiable to credit Pascal with it because he carried out the first systematic investigation into its properties.
Their work on probability arose out of gambling problems.
Slide: A gambling problem: the interrupted game
One of these problems was:
What is the fair division of stakes in a game which is interrupted before its conclusion?
Example: suppose that two players agree to play a certain game, say tossing a coin, repeatedly to win £64; the winner is the one who first wins four turns.
If the game is interrupted when one player has won two turns and the other player has won one turn, how should the £64 be divided fairly between the players?
So, for example you, and I toss a coin. If it is heads you win and tails I win. We agree that we will keep tossing the coin until one of has four wins. But the fire alarm goes off when you have won twice and I have won once and we have to stop the game.
What is the probability that each of us would have won if we had been able to continue?
Fermat’s approach was to imagine that another four tosses did take place and he listed out all the possibilities and the crucial thing is that all these different outcomes for the next four tosses are equally likely.
Also the game would be decided after at most the next four tosses because one of us must reach four wins. Four is the maximum number of tosses needed to decide. For example: I win the next two tosses so we are at two for you and three for me. Then you win the next two tosses and win the game. So it takes four tosses to get a winner. It never takes more but it could take less. For example if you win the next two tosses you win and the game is over after two tosses only.
Slide: Interrupted game: Fermat’s approach
Let us list all the possible outcomes for the next four tosses. All outcomes are equally likely and are (Y = you, M = me):
The yellow ones are where you would have won and there are eleven of them. The red ones are where I would have won and there are five of them.
Probability you would have won is 11/16
Probability I would have won is 5/16
So if the prize was £64 you should get 11/16 of £64 which is £44 and I would get £20.
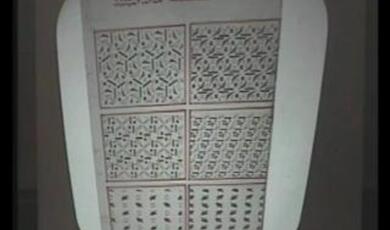
Slide: Interrupted game: Pascal’s triangle
Pascal took a different approach, which made use of what is now called Pascal’s triangle.
What Pascal called his Arithmetical triangle had been used in various cultures for more than 500 years.
To build the triangle, start with one at the top, and down both sides. Each other number in the triangle is the sum of the two numbers above it.
The triangle has several interesting features. For example the first diagonal sloping down and to the left contains only 1s, the next the natural numbers 1, 2, 3, … and the next the triangular numbers 1, 3, 6, 10.
To solve the problem of the interrupted game Pascal used the principle of mathematical induction, and, in fact, gave the first explicit statement of this principle of mathematical induction.
For example, he uses it to prove that the sum of any row in the triangle is a power of two, as you can see written down the right hand side. He did this by showing that the sum of the numbers in any row is twice the sum of the numbers in the row above. So starting at any row the sum of its numbers is twice that of the row above which is twice that of the row above it and so on, each time multiplying by two until you get to the top row which has sum one.
Slide: Interrupted game: Pascal’s approach illustrating Fermat
Pascal’s triangle also gives the number of different ways of making selections of say two objects from four or three objects from four. In this slide we can see the connection with Fermat’s approach to the interrupted game.
It is the same example as before where the game was interrupted when you had won two and I had won one. On the left we see the sixteen possible outcomes for the next four tosses. The eleven of them which would lead to you winning correspond to the first three numbers in row five.
There is one way of you winning all four.
There are four ways of you winning three of the next tosses.
There are six ways of you winning two of the next four.
The ways for me to win are the red numbers in row five.
Slide: Interrupted game: Pascal’s approach of first to 5
In this slide imagine I have changed the end point for the game and now say the winner is the first to five wins. We are interrupted again at the stage with you having won two and me one. But now there is a maximum of six games to be played to win the result – because I could win the next three and then you win the following three. The probability of you winning is now (1 + 6 + 15 + 20)/64 = 42/64.
And of me winning is (1 + 6 + 15)/64 = 22/64.
Now let me show that our mathematical model of probability agrees with our frequency interpretation of probability. In other words if a coin is fair then when we keep tossing it the fraction of heads obtained approaches ½.
Slide: Toss coin 10 times
Let us consider the case of tossing a coin ten times and counting the number of heads that turn up. Then the fraction of times that heads turns up is obtained by dividing by ten and it will have values between zero and one.
Along the horizontal axis I have plotted the fractions for all these possibilities.
On the vertical axis I have plotted the probability of obtaining those different numbers of heads. These probabilities can also be obtained from Pascal’s triangle.
Slide: Law of large numbers different values of n
Here I have plotted the distribution for increasing values of n – for n = 10, 20, 30, 40, 60 and 100. The red dots at the top of the spikes are the fractions between 0.45 and 0.55.
The Law of Large Numbers predicts that a larger and larger percentage of the total area is contained within the interval 0.45 to 0.55.
Indeed as n increases the distribution gets more and more concentrated around 0.5
This shows that our mathematical model of probability agrees with our frequency interpretation of probability. In the long run the fraction of heads obtained on tossing a fair coin approaches ½.
There is another result which describes how spread out the distribution is and is called the Central Limit theorem and one of the things it allows us to say that most of the area or probability is within of times we observe some
Interesting features and I want to introduce them using the idea of a random walk.
Slide: Symmetric random walk
At each step you move one unit up with probability ½ or move one unit down with probability ½.
An example is given by tossing a coin where if you get heads move up and if you get tails move down and where heads and tails have equal probability.
It can also be used as a model for two queues where going up means the queue you are in is moving ahead and moving down means that the queue you are in falling behind.
Slide: Coin Tossing
I have done some simulations using a spreadsheet to illustrate the behaviour obtained.
The first column generates a +1 or -1 with equal probability. The second column keeps a running total of the numbers generated to that point.
On the graph the vertical axis is the difference between the number of heads and the number of tails. The horizontal axis is the time in the form of the number of tosses. I have done it for 500 tosses.
Take a moment to think about the type of path you would expect.
Most people think that in a long coin tossing game each player will be on the winning side for about half the time or that half the path will be above the horizontal axis and half below. They also believe that the lead should change frequently.
The path you see does have about half of the time heads is in the lead and half the time tails is in the lead but it took me quite a few tries to get this result because it is not the usual path you get.
Let me show you ten other paths in the order I obtained them.
Slide: Ten Paths
1. In this case Heads is always in the lead.
2. Here a bit of oscillation but then tails is always in the lead
3. Here heads most of the time then tails for a short time and then back to heads
4. Here heads all the time but their be a short time when tails took the lead
5. Here mainly tails but on occasions heads goes ahead for a short time.
6. At the start it is heads and then tails ahead
7. Heads always ahead here.
8. Tails is ahead most of the time here
9. Heads all the time here
10. Again heads all the time.
These results are typical and as I say were the results of ten simulations.
Slide: Law of long leads or arcsine law
The law of long leads, more properly known as the arcsine law, says that in a coin-tossing games, a surprisingly large fraction of sample paths leave one player in the lead almost all the time, and in very few cases will the lead change sides and fluctuate in the manner that is expected of a well-behaved coin.
The numbers are quite remarkable.
• In one case out of five the path stays for about 97.6% of the time on the same side of the axis.
Slide: one case out of ten
• In one case out of ten the path stays for about 99.4% on the same side of the axis.
Slide: coin tossed once per second
• A coin is tossed once per second for a year.
In one in twenty cases the more fortunate player is in the lead for 364 days 10 hours.
In one in a hundred cases the more fortunate player is in the lead for all but 30 minutes.
Slide: Number of ties or crossing the horizontal axis
Interpreted geometrically in terms of random walks, the path crosses the x-axis rarely, and with increasing duration of the walk, the frequency of crossings decreases, and the lengths of the “waves” on one side of the axis increase in length.
We might expect a game over four days to produce, on average, four times as many ties or crossings as a one-day game
However the number of ties only doubles, that is, on average, increases as the square root of the time.
These results are surprising.
The symmetry of the fair coin is still here. But the symmetry does not show itself in half the path being above the axis and half below.
Rather the symmetry shows itself in that half the sample paths are mostly above the axis and half the sample paths are mostly below the axis.
Now for something else that is very beautiful.
Slide: Antony Gormley's Quantum Cloud
This is Antony Gormley's Quantum Cloud. It was commissioned for a site next to the Millennium Dome in London. At 30m high, I believe it is Gormley's tallest sculpture to date (taller than the Angel of the North). It is constructed from a collection of tetrahedral units made from 1.5m long sections of steel. The steel section were arranged using a computer model using a random walk algorithm starting from points on the surface of an enlarged figure based on Gormley's body that forms a residual outline at the centre of the sculpture
We could also consider paths that have their end points fixed as in an election or ballot when we know the final result of how many votes are cast for each candidate. Assuming only one person does the counting of the votes we could ask for the probability that the winner is ahead from the start. This is an example of a ballot theorem.
Slide: Ballot Theorem
Suppose that in a ballot candidate Peter obtains p votes and candidate Quentin obtains q votes and Peter wins so p is greater than q.
Then the probability that throughout the counting there are always more votes for Peter than Quentin is kely to get kicked further away as to get kicked back.
Slide: Simulation of Brownian motion
Here we see a simulation of Brownian motion. The yellow blob represents the particle and the rapidly moving many grey ones the molecules.
It was Einstein who was able to quantify mathematically the jittery erratic motion.
One of the easiest ways to approach Brownian motion is to use random walks. We will do it in one dimension for a particle moving on a line but it is not hard to extend to three dimensions.
Slide: From random walks to Brownian motion
As before at each step you move up with probability ½ or move down with probability ½.
We now want to think of Brownian motion as a random walk with infinitely many infinitesimally small steps.
If we are using a time interval of length t let the time between steps be t/n and at each of those points we let the jump have size 1/√n.
© Professor Raymond Flood, 2014

 Login
Login