Login
Login
Home Office Mathematics

Share

- Details
- Transcript
- Audio
- Downloads
- Extra Reading
The Chief Scientific Adviser is the head of Home Office Science, which provides scientific advice and support to the whole range of the Home Office's work as the lead government department for immigration and passports, drugs policy, crime, counter-terrorism and police. Many aspects of our scientific work involve mathematics, and in this talk a selection will be presented. These show not only how mathematics is used by one particular government department, but also how wide is the range of topics where mathematical thinking and methods are important.
This is the 2012 joint London Mathematical Society / Gresham College lecture.
The other lectures held in collaboration with the London Mathematical Society include:
Mathematics: The Next Generation by Professor Peter Cameron
Undecidable and Decidable Problems in Mathematics by Professor Angus MacIntyre
Indra's Pearls: Geometry and Symmetry by Professor Caroline Series
Mathematics and Smallpox by Professor Tom Körner
Cancer can give you maths by Professor Philip Maini
Multiplying and Dividing by Whole Numbers by Professor Timothy Gowers
Can maths catch criminals and bring them to justice? by Professor Christopher Budd
Download Transcript

15 May 2012
Home Office Mathematics
Professor Bernard Silverman FRS
I am going to, first of all, talk a bit about Home Office science, because people say, “Well, what science is there in the Home Office?” Of course, the purpose of the Home Office is to look after us all, and I am told that the original lectures were given in Latin as well as in English, and so you can ponder the question: “Quis custodiet custodies ipsos?” which means, I have to translate it, don’t I, I went to school about 300 yards from here and we learnt Latin. It means: “Who looks after the people who look after us?”
We have consolidated Home Office science into a single organisation under the leadership of the Chief Scientific Advisor. I should explain that Home Office science is not just myself; it is a reducing number, but about 300 people, in different areas of science, who work in the Department, which I head. I do two different things: one is to be a Scientific Advisor in my own right and give advice on particular topics which I either know about or keep a few pages ahead in the book, or know someone else who knows something; and also, secondly, I manage a large group of really very talented people that it’s a great privilege to work with.
The main work of the Home Office is in three areas: crime, migration and counter-terrorism. We also include: work on registration - we include the General Register Office; the issue of passports; the Government Equalities Office; and also, one piece of my work is on the regulation of animal experiments. So, you can see it’s a very wide brief, not as wide as it was in the Eighteenth Century, when there were only two Departments of State, I believe – the Northern Department and the Southern Department. The Northern Department dealt with things from here north – in other words, Britain, roughly speaking; and the Southern was abroad, everywhere else! So, it is not quite as it was, but that is how it was originally.
Science is involved in all these areas – crime, migration, counter-terrorism, and so on – and in a day’s work, I find myself involved in everything. You realise, at the end of the day, that you have been talking or dealing with scientific work in all of these different areas, possibly just reading something someone else has done, or trying to explain to the Ministers why we should be doing a particular piece of work, or actually giving your own particular expertise. It is really rather interesting.
And sometimes not all my input is specifically mathematical. It is often to do with biology, with social science, or just the general principles of scientific method. But, underneath it all, and of course mathematics is really like this, because, frankly, you know, all science is maths, that it often involves statistical and mathematical thinking.
Regarding our structure, we have the Centre for Applied Science & Technology (CAST). Like all good new managers, the first thing I did when I came in was re-brand the entire organisation – it used to be called something else. It is made up of about 150 people, based on two sites near the M25, one near St Albans and one near Horsham. I will tell you something about the work of CAST later.
Then we have a secretariat, which looks after our advisory committees, and does things like help me if I have to appear before a Parliamentary Committee. We have Home Office Statistics, which produces statistics on various different areas. And we have teams of operational researchers, economists, social researchers and so on who support policy in the various areas.
So, that is an overview of the whole structure.
What I am going to do is to give you a few vignettes of little pieces of work that we do, and it will give you an idea, as I say, both of the scope of Home Office science and, on the way, we will do some mathematics.
We compile statistics on all aspects of our activities, but we have recently transferred crime statistics to the Office of National Statistics. Now, the way crime statistics are collected is, it is so interesting, because there are two different sources of crime statistics: one is police-recorded crime; and the other is a thing called the British Crime Survey, shortly to be renamed the Crime Survey of England & Wales, because that is what it is.
The police-recorded crime is simple: you are the victim of a crime, you report it to the police, they clock it up on their computer, and then we publish the data.
The British Crime Survey involves asking people if they have been the victims of crime, doing a survey, and it is a very interesting piece of work to collate these two because, of course, not all crimes are reported to the police, and also, the way that police report crimes is not necessarily the way you think they do. In other words, because crimes have technical definitions, you might imagine that you have been a victim of one sort of crime, when the police, according to their technical definition, define the crime in a different way. So, if I ask you what happened to you, you might say, “Well, I was a victim of burglary,” – I am actually not sure whether that still exists, but – and the police might have put that down as a different kind of theft. That is the sort of thing I mean. The other thing is that not all crime is reported and so the level of crime, as measured by the police-recorded crime, is not the same as the level reported by the British Crime Survey.
Government is most interested in whether crime is going up or down. Over the last twenty years, crime has generally gone down, but the Government does not feel, and rightly so, that it is at a reasonable level – they still feel it is too high. The real problems arise if the two statistics start going in opposite directions. You can see it is very sensitive and that is one of the reasons why the Government has decided that it would be better for the Home Office not to collect these data at all, not to publish them, but it to be done by the completely independent Office of National Statistics, and so that is what they have decided to do. But, at the moment, we are still doing it ourselves.
Most Government statistics are not statistics in a very mathematical sense but it is a matter of carefully collecting and analysing data from various sources. Some of the work we do, we have to be rather clever about the way we do it because it can be very, very expensive to collect the data directly and it is often better to do something using some cunning administrative source or use some other process that you are doing in order to collect the data. So, police-recorded crime is of that kind, and so that is very interesting.
The other thing we do is social and economic analysis to underpin policy and operations in all these areas – crime and security and migration. Although some of that is qualitative, involving small-scale work such as talking to people and things like that, or some is straightforward quantitative work, as I have just said, some of it involves somewhat more sophisticated mathematics, particularly of a statistical nature. It is really to think of the cunning way of measuring something in the most cost-effective, but still accurate, way that we can.
I want to talk a bit about the Migration Advisory Committee, so this is the first of my little vignettes. This is not actually under my purview, but it is part of the work that we do. One of the things that is very interesting is to measure the economic impact of possible migration policies, and in order to do that, it is necessary to have an estimate of what is called displacement, which is this question: if a person comes to this country, do they displace someone who is already working here? What is the reduction in employment of those already here caused by new immigrants into the country? We have a thing called the Migration Advisory Committee, and that is one of our expert advisory committees, and they have done some work on this. This illustrates the way we use expert advisory committees and also I am going to explain what they actually did. They are particularly concerned about the effect of migration from outside the European Union.
So, how did it work? Well, there are two possible answers to the question I just asked. The first is what economists normally will tell you, and this is about something called the “lump of labour fallacy”. Classic economic theory says that there is no fixed number of jobs, but employment rises to match any increase in labour force. In other words, if there is 5% unemployment and a lot of people come to the country, there will still be 5% unemployment and the number of jobs will grow to match the number of people coming into the country. The idea that the number of jobs is fixed is called the “lump of labour fallacy”, and I might say, this applies equally to arguments about whether increasing the retirement age takes away jobs from younger workers, so the notion that people will have to work longer and that is taking jobs away from younger people is the “lump of labour fallacy”. Classic economics says that the “lump of labour fallacy” is a fallacy – in other words, if more people come into the country, it does not displace any existing workers.
The popular conception is different. The popular conception is that the total number of jobs is indeed fixed, or more or less so, so if a worker comes in from abroad, it takes away a job from someone else, so someone else is out of work as a result. Or, for that matter, if someone stays in a job beyond retirement age that again would have the same effect. But I want you to just see why that might not be so, because, if someone is working, they spend money and they pay taxes and so on and so on, and so that creates economic activity, which creates jobs for others, and that is why economists say that this does not happen.
The Home Secretary asked the MAC to think about this and do some analytical work, and that is what I am going to try and talk about. They used an econometric approach, as follows: so they took data for various regions of the country over several decades, about 30 years, and in every region and in every year, they found the demographic composition, so let us say – “native”, in this sense, I am not sure it means native-born but it means completely settled. It may mean native-born, but it does not make any difference because we are looking at changes and you will see because we look at the way this composition changes. If someone is in a particular group, it does not matter where they are, it is how the numbers change in the different groups that will make the difference. We have got native EU and non-EU and the employment rates, and then they used a statistical multiple regression. What they then did was, they took this demographic composition and they took the employment rates, and what economists then do is they difference everything so they see how much did these, this ratio between these things, change and how much the employment rate changed. That gives you, for every year, and every region, you get to essentially a few data-points, and then you can construct a statistical model that says: how do the changes in demography correlate with the changes in employment? And that is what they did and they fitted a multiple regression model, and this was the answer.
So, the MAC analysis showed that neither of the two extremes, or the two things I said earlier, were true: so it was neither the case that, if someone comes, it makes no difference to existing workers; nor was it the case that there is a complete displacement. Their data analysis shows – it is a very big thick book, it is published so you can read it – that the displacement caused by migration from outside the EU is, in the short run, about 23%, with a standard error of 5.5%, so that means it is somewhere between 10% and 30%, so it is not very accurately estimated. But what this means is, if it was 25%, it would mean that, for every four migrants that came in, there would only be three jobs, so one existing worker would not be employed, and that is interesting, but they also found that, after a few years, the effect the washes out, so after five years, there is no discernible displacement effect. This is an extremely important result for Government policy because it shows – and it is contrary to the standard economic position – that there is indeed some displacement, and it quantifies it, and, if I may say, it also accords with common sense. It is sensible too. It is rather nice when a bit of work like this comes up with something which makes sense, because if a lot of people come in, it will have some depressing effect on the economy, short-term, of the people already there, but in the long run, it will not, and also that it is only 23% - that makes sense also. That is quite interesting, and that makes a big difference to the way that the Government’s migration policies pan out in terms of their economic effect on the country. It demonstrates a big difference and so it has been very important.
I might say, they did it for EU as well, I should just tell you what the EU result is. The result for EU migration is that the displacement effect is 23%, but it has got such a big standard error that you cannot say it is not zero, and so you cannot be sure it is not zero because the standard error to confidence was so large that it actually includes zero as a possibility, and in any case, that was not part of the main question.
Moving onto Animal experiments. I feel very honoured to be here – in a minute, I’ll explain why. There is a point at which I am going to sit down and ask someone else in the audience to give the rest of the talk. But anyway, part of my responsibility is to oversee issue of licences for experiments involving animals, and I hope you will not be offended if I quote – a well-known scientist. I think it is Colin Blackmore who said that there ought to be a notice in every doctor’s surgery that said: “Every medicine and every treatment recommended in this surgery has been tested on animals, and the reason is, you would not want to take something if it had not been tested to be safe and effective, and animal experimentation is part of that.”.
However, I have, in my life, seen some horrific and unnecessary animal experiments, I have to say. About 30 or 40 years ago, I visited a place where they were trying to test cigarettes. They had pigs that smoked in order to try and design less dangerous cigarettes, and this seemed to be a completely immoral experiment for two reasons: first of all, you should not do that sort of thing to pigs; and secondly, there are plenty of willing human subjects, who will even pay for the privilege of taking part in this experiment!
About smoking, it shortens your life – it doubles your death rate at every age. There is some lovely statistical work, done many years ago. Whatever you chance of dying in the next year is, if you smoke, it is double, so not a good idea. In my previous job as the head of a college, I used to try to say this sort of thing to young people, and they just got very angry. Fortunately, I am talking mainly to people who will be taking it more seriously.
So, we have, rightly, arrived at an ethical view that we should be very careful about what experiments we do, and there is a detailed system of regulation in place. Part of that is based on the “three Rs”, which are “replacement, refinement and reduction””. These have been, for some years, part of the Government’s policy, but they are underlined by the Coalition agreement which explicitly commits to working to reduce the use of animals, which is what was going on anyway.
There are just two mathematical things I might talk about. The first thing is the idea of replacement, which this is the notion of using methods other than live animals wherever possible. As our understanding of both genomics and the way that drugs work improve, we can predict, to some extent, how a new compound will work. You do not have to just blindly try it out because you can already know, to a large extent, using mathematical models, lots of computer stuff, around chemistry, biology, genomics and so on, what the effect is likely to be, and that will allow you to triage a lot of methods out, which you would not have been able to before, and a lot of that will depend on computer modelling, and so that is very important.
The other area is reduction, which is that we should not use any more animals than we absolutely have to, but I should also add, we should make sure we use enough animals so we get a proper result, otherwise you are wasting that resource. This is the shameless plug for Rosemary, who is sitting there, and she is one of the world’s leading authorities on experimental design, and the crucial component of reduction is proper statistical experimental design.
Experimental design, which I will not go into in detail, it is a mathematical technique which ensures that, when you do an experiment, you do it as efficiently as possible, and there are a lot of very clever ideas about ways of testing lots of different effects simultaneously and getting the most information you can out of expensive and valuable experiments.
And then, when you have done your experiment, you can go out to dinner and eat meat - or drink milk, for that matter, if you are vegetarian – which are produced in ways that I would never give a license to at all. You can do virtually anything to the farm animal you like, or the chicken, but you cannot if we are giving you a license to do so.
And so part of my work is to encourage the use of proper experimental design among people who are performing animal experiments, and it would be great if statisticians would take seriously their responsibility towards the animal experimentation community to help them with their experimental design.
Now, I want to talk about finite element analysis. Some of you will know what this is and others will not, so I will just give you an example of this. One of the things we want to do is to protect buildings from explosions, and predicting how an explosion will affect a building allows us to design a safer building. A building is a complex object, so how do we actually model it?
There is a method called finite element analysis, which is a method from Applied Maths, and this is a way of simulating complex physical systems. What you do is you use formulas from physics, but you combine those with an enormous amount of computer power, and those are the two things that you need. The history of this goes back to the ‘40s, the ‘50s.
It is the 1940s, and Zienkiewicz was the man who really did it.
What you do is you break the structure down into a large number of small elements. Time is also broken down into little steps, and the effect of each element on its neighbours is worked out. It is complex because it is both space and time. It was absolutely prophetic to have thought all this up in the days before there was heavy computer power.
What is also interesting – not a Home Office issue – is that climate modelling works the same way. The way climate modelling work is that you take the whole of the Earth’s atmosphere and the sea and all this sort of thing, and then you break it up into layers and pieces and so on and so on, and you then run time for years and years and years, and you have equations that explain what goes on, and that is how climate models actually work, and that is why you need such enormous computers. The hunger for computer power with finite element analysis is enormous, and I will just show you how it works in one case that we have got.
I will show you a video of modelling a bullet hitting a piece of glass. The elements of the glass are different sizes and near where the bullet hits, the pieces are tiny, far away, they are large, and the other thing we do is, if an element is damaged in the equation, then it is destroyed. So, let us have a look at where we are with it.
Before I fire the bullet, let me just show you something. The little pieces that you work out the physical equations, they are very small, and then when you get a long way away from where the bullet’s going to hit, you just make the boundaries larger and larger and larger, and similarly in this direction, and so an element is just a tiny little cube and the way it has to work is that the element is long and thin, and over here, it is a flat piece. I do not know enough about this example. If it is done sensibly, it is possible that these are thicker as well, but I am not sure how easy that would be to do.
That is a clever little trick that helps you if all the action is going on in one place. If the action is going on everywhere, as in climate modelling, it does not help you very much, except – I do not know enough technically about it, but I would guess, if you were interested in the climate in a very small place, you might have larger elements further away.
Finally, on climate, you know the joke within this country, and it is particularly true at the moment: there is no climate, only weather! I believe this year seems to be particularly so! In other words, it is all statistical variability and there is no underlying thing at all. That is not true, unfortunately. There is undoubted climate change.
And the bullet itself, it has also got little elements in it, so we have got brass on the outside and lead there, and the way it would be modelled is that the physical equations will be different for the glass and the for the lead and for the brass because they all behave differently under pressure.
You can see this is a computer model of what happens when the bullet goes through the glass. You can see the bullet deforming as well. So there is an example.
So, this approach can be used to model all sorts of things: wind on skyscrapers. The effect of dropping an electronic device – so if you wanted to produce an electric device that was very robust, you would use a finite element analysis on the design that you had produced. There might be applications where you want to do that. It can do how an earthquake affects a building, how an explosion affects a structure, and climate – and, in fact, any physical system at all that involves components, and that is all sorts of things, so it is a very wide thing.
We are going to show the effects of a blast on a simple structure. There is a little interesting trick. So, we will start by thinking about inside the structure, and what we do is we break up the space into small units and let the blast move. What I want you to imagine is there is going to be a blast, blow-up in a minute, but imagine that the outside of the structure is fixed. So, this is what happens.
You get the explosion, and then waves go backwards and forwards. For the sophisticated members of the audience, the numbers on the left show that the range of the colour scale is getting smaller as we go through time. In other words, the difference between red and blue is much smaller at the end than it is at the beginning, pretty obviously. But what it does show is where the positions of high pressure are, which is very important in an explosion.
Now we are going to model the effect of the blast on the light parts of the building. This time, instead of breaking the space in the building up, the building is three-dimensions, you might think we are just looking at the walls and the roof, and the walls have bricks in and they are themselves finite elements, so you could actually model bricks in walls as being individual elements, and that is what is done.
Here is the next example, what happens is, you have got the bricks, the doors and the roof, and so pressure eventually forces those out and that is what happens, and so the light parts blow off and so on. One way of making a building that will not fall down is to make the roof so that it can blow off, but the problem with that is that you would have a roof blowing off, but it may be better than having the other thing.
So, the light parts of the building are removed from the modelling once they detach from the structure. Once the doors have gone, they have gone, and to find out what happens to them, we can model the bricks as elements, and then the physics is gravity and the effect of the pressure of the blast, and you can see what goes on with that.
That is what happens to the walls. What is interesting is, you can combine different parts of the modelling, you cut up the air inside the building into lots of little cubes, but the walls, you do not have to do that because they are essentially two-dimensional, and you can just model those as individual bits, and of course, you get the idea of how far the damage is likely to go.
We do blow real things up – trains, buildings, etc. We do not do it on our own premises but the Home Office has done work on things like the effect of blasts on trains and on buildings, and it is obviously very important, unfortunately.
Now, I am going to go back, from something invented in the 1940s, to something invented in the minus something or others, about 200BC – Archimedes and now!
We are interested in locating a radio transmitter. Why? Well, it could help us to protect vulnerable people and VIPs. It could help us to keep track of offenders and property, and to undertake search and rescue operations. There are various different contexts. Of course, I should explain, this work is a little old, and there is GPS now, but GPS is not that accurate and not every item is amenable to GPS, so I just wanted to say that.
We do not always have control of the transmitter, so how can we find it? If someone has a radio, how can we actually find that?
I am going to talk about conic sections. Many of you will know this, but for those that do not, conic sections are things that probably younger people do not know anything about at all. Those of us that were educated some time ago learnt all about them, but I imagine a lot of young people do not.
If you take a cone and you cut through it, you get a circle, a little green circle. A circle is all the points, which are the same distance from the centre, and so the blue line length as you go round the circle is constant, so as you go round the circle, that is what you get.
If you cut the cone at an angle, you get an ellipse. An ellipse has the property, as many of you will know, that the sum of the two lengths is the same. I remember, when I was a kid, trying to draw one by having a piece of string, two pins and a pencil, and as the pencil went round, it gave an ellipse, except I am not very good at physical things, so it did not always quite work, but that was the idea – easier to write down all the coordinate geometry, isn’t it? And so, what happens, as you go round the ellipse, is that the sum of the two lengths is constant.
There is also a thing called a hyperbola, which is what you get when you cut a cone that way, and you get a curve like that green curve there, and that has the property that the difference of the two blue lines is fixed, so that distance minus that distance is the same.
Now let us imagine the way we find things. Let us suppose that we are trying to find them – that is a good way of thinking about life, isn’t it? Or maybe they are trying to find us…but anyway, we are us and we are trying to find them, whoever they are, and they can receive and transmit, and so can we.
What we do is we transmit a trigger signal, they reply immediately, we receive a reply, and we measure that distance, so we know how far away they are. We do not know which direction; we know how far away they are.
Radar works like that, without transmission. It works just by reflection, but of course the amount of signal you get back is not very great. So I want us to presume that you get an actual signal coming back.
Right, so we can calculate the distance. We know where they are, and the point is that they are somewhere on the circle. So, basically, if we are us, we can always find out which of these blue circles they are on but if they are nearer, they will be on one of the inner circles and so on.
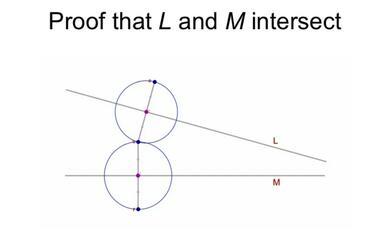
Imagine there is one of us, we send and receive, and we discover that they are on the green circle, and then there is another of us, two of us, so I have one of my colleagues over here, and she or he finds out that the individual or the transmitter or the object is on the blue circle, and then we have the third one, so that is three of us, and they are on the purple circle, so they must be there, so they must be at that point on the intersection.
Now, what do we need here? They have to have a transmitter-receiver, and we need three transmitter-receivers: one to do that, one to do that, one to do that, and each one has to do a ping and get a ping back, and so you need six transmissions to get a fix. The other thing is, of course, if they do not all happen at the same time, this thing may have moved around, so you have to also coordinate where you are. Six transmissions, and you have to coordinate, and they have to hear you and you hear them.
There is a thing called multi-receiver radar which works rather differently, which is where all I do is transmit and you have a receiver – English language is good, is it not?, three different persons. So, I transmit, they hear it, transmit, and you receive, okay. You receive a signal somewhere else and you measure total flight time to calculate the total distance. You might call this friendly reconnaissance because I imagine they do not mind you knowing where they are.
Interestingly, what we measure is the total distance from me to them to you, and that makes us think about ellipses, and that is indeed what you get. If they are there, you know that they are on that ellipse – that is an ellipse because you know the total time it took to get from here to there to there.
This is interesting, because, imagine if I had another receiver, but the same transmitter. The sum of the distances is known and so therefore they are somewhere on the ellipse.
And so, if I am here and you are there, we can pin someone down to be on one of these ellipses, and in this case, the green one.
So let us suppose that is our transmitter, so that is me and I have a transmitter and receiver, so I know they are on the green circle. But, I also have another receiver over here, just a receiver, and that receiver, with that, I can find out that the individual thing is on the blue ellipse, and then I can have another receiver, and then I get another ellipse, and obviously that means that what you are looking for is there.
The point is that they need a receiver and transmitter, we still need three receivers, but there is only one transmitter and there is only one transmission from me and there is only one transmission from them. It is a single ping, but you can pick it up in three different places and then get ellipses, and so that is a lot better, for various obvious reasons.
I am finally going to talk about what you do if you want to find a transmitter where you do not want to transmit anything. We can receive in two places, they can transmit, the transmit and we measure the time of reception in two places, and the difference, and then you use a hyperbola, and we measure the time of reception in two places, we calculate time difference of arrival, and that gives us a hyperbola, and so we know that they are somewhere on the hyperbola.
Then you have another receiver, so that is one pair that you know are on the green hyperbola. You have another pair, you know they are on the blue hyperbola, and immediately, by using this pair, you get a third hyperbola, which looks like that, and someone who is better at maths than I am will tell me whether it also meets over there. The point is that you think the person is there. So, they transmit at random, we have three receivers, we do not need any transmitters at all – all we need to be able to do is discern the difference, and we can do it silently and there is only one transmission.
So, what is fun about this, is that if you did not know about conic sections before, you do now, but even if you did, it is a way you can explain to other people why conic sections actually have an application nowadays, 2,500 years after they were originally come up with.
The last thing I want to talk about is Monte Carlo modelling. Our operational researchers use Monte Carlo modelling even as I speak, in many different contexts. Monte Carlo modelling is calculating many real systems work randomly and you basically generate random numbers and then you put them into the system and you can figure out how the system will actually operate. Of course, often, if you take queuing theory as an example, you can predict mathematically things about the queue without doing all the Monte Carlo modelling. The advantage of Monte Carlo modelling is that you can predict quite complex systems to see how they will actually work. So, Monte Carlo modelling is very important, and this can involve both human behaviour and physical systems, and, in the Home Office, we do both.
The last example I am going to give, very briefly, is one of these. So, there is a thing called Programme Cyclamen. This is off a website. It is a key part of the Government’s counter-terrorism strategy. It involves the screening of incoming freight, vehicles, passengers and pedestrians to detect and deter the illicit importation of radioactive and nuclear material by anybody!
There is fixed radiation detection equipment at ports and airports and there is mobile capability supporting fixed portals to keep us safe by ensuring that air, sea and Channel Tunnel traffic entering the UK is subject to screening. This is all public information, as is everything I am going to talk about. But what I want to say is that there is a problem because, if you bring in a lorry-load of bananas or of ceramic tiles, that gives out a lot of radiation. So, simply measuring whether something gives out radiation is not enough to discover whether it actually is harmful.
One of the important things in the design of all this is that radioactive decay is random, and it is difficult to predict what escapes from a hidden source and how do we model it, and the question is: how do we distinguish a lorry-load of bananas or ceramic tiles from one containing illicit radioactive material?
The difference is of course that bananas, because they have potassium in, do actually have quite a lot of radioactive material – and there are all these stories about how many bananas would you have to eat to get the same dose of radiation as you did by living in Tokyo during the Fukushima event – probably one or two or something. I do not know what the answer is.
And certainly getting in an aeroplane, as you know, it exposes you to a lot of radiation, as does living in Cornwall – so do not live in Cornwall!
So, illicit radioactive material comes from small pieces, so that is the difference really.
How do you model it? Atoms emit radiation, and they emit it at a random time, in a random direction. The radiation can hit another atom, change direction, trigger another emission, and so on and so on. Difficult to calculate probabilities for chain of events – I am not going to show you a test of this sort, we are only going to do the mathematics, but you can use a random simulation model to repeat possible outcomes, thousands of times, to build up the overall pattern.
A natural radioactive source is spread, in general, all over the cargo. So to get a reasonable amount of radiation, you need a lot of bananas. This is a schematic of the detectors and a container.
A threat is probably a single item in a load, and of course one is looking for quite small quantities. Simulations can distinguish the different patterns that each scenario presents, and this is some work that was done at some time to look at that.
Well, that is a tour through a lot of different things. I hope it has given you a flavour of the sorts of things that we do. I am very happy if people want to ask any questions, either about this or anything else that I might be doing and I hope that I have managed to share with you something of the flavour of what we do in the Home Office in our scientific work. So, thank you very much indeed!
© Professor Bernard Silverman FRS 2012
This event was on Tue, 15 May 2012

Support Gresham
Gresham College has offered an outstanding education to the public free of charge for over 400 years. Today, Gresham plays an important role in fostering a love of learning and a greater understanding of ourselves and the world around us. Your donation will help to widen our reach and to broaden our audience, allowing more people to benefit from a high-quality education from some of the brightest minds.