Login
Login
Watchers of the skies

Share

- Details
- Transcript
- Audio
- Downloads
- Extra Reading
How our knowledge and understanding of the universe has increased over the centuries so that we now have a surprisingly accurate idea of its size, age and makeup - much of it unseen in the form of dark matter and dark energy!
Download Transcript
WATCHERS OF THE SKIES
Professor Ian Morison
Astronomy is probably the oldest of all the sciences. It differs from virtually all other science disciplines in that it is not possible to carry out experimental tests in the laboratory. Instead, the astronomer can only observe what he sees in the Universe and see if his observations fit the theories that have been put forward.
Galileo Galilei's proof of the Copernican theory of the Solar System.
One of the first triumphs of observational astronomy was Galileo's series of observations of Venus which showed that the Sun, not the Earth, was the centre of the Solar system so proving that the Copernican rather than the Ptolemaic model was correct. He had made observations of Jupiter which showed four moons - now called the Galilean moons - weaving their way around it. This showed him that not all objects orbited the Earth!
In the Ptolemaic model of the Solar system (which is more subtle than is often acknowledged) the planets move round circular 'epicycles' whose centres move around the Earth in larger circles called deferents. This can account for the 'retrograde' motion of planets like Mars and Jupiter when they appear to move backwards in the sky. It also models the motion of Mercury and Venus. In their case, the deferents, and hence the centre of their epicycles, move round the Earth at the same rate as the Sun. The two planets thus move round in circular orbits whose centres lie on the line joining the Earth and the Sun, being seen either before dawn or after sunset. Note that, as Mercury stays closer to the Sun than Venus, its deferent and epicycle are closer than that of Venus - in the Ptolemaic model Mercury is the closest planet to the Earth!
The centre points of the epicycles for Mercury and Venus move round the Earth with the same angular speed as the Sun.
In the Ptolemaic model, Venus lies between the Earth and the Sun hence it must always be lit from behind so could only show crescent phases whilst its angular size would not greatly alter. In contrast, in the Copernican model Venus orbits the Sun. When on the nearside of the Sun's it would show crescent phases whilst, when on its far side but still visible, it would show almost full phases. As its distance from us would change significantly its angular size (the angle subtended by the planet as seen from the Earth) would likewise show a large change.
The figure below shows a set of drawings of Venus made by Galileo with his simple refracting telescope. They are shown in parallel with a set of modern photographs which illustrate that not only did Galileo show the phases he also correctly drew the changing angular size. These drawings showed precisely what the Copernican model predicts - almost full phases when Venus is on the far side of the Sun and hence has a small angular size coupled with thin crescents having a significantly larger angular size when it is closest to the Earth.
Galileo's drawings of Venus (top) compared to photographs taken from Earth (below).
So Galileo's observations, made with the simplest possible astronomical instrument, were able to show which of the two competing models of the Solar System was correct. In just the same way, but using vastly more sophisticated instruments, astronomers have been able to choose between competing theories of the Universe - a story that will be told later.
The Celestial Sphere
Looking up at the heavens on a clear night we can imagine that the stars are located on the inside of a sphere, called the celestial sphere, whose centre is the centre of the Earth.
As an aid to remembering the stars in the night sky, the ancient astronomers grouped them into constellations representing men such as Orion, the Hunter, women such as Cassiopeia, mother of Andromeda, animals and birds such as Taurus the Bull and Cygnus the Swan and inanimate objects such as Lyra, the Lyre. There is no real significance in these stellar groupings - stars are essentially seen in random locations in the sky - though some patterns of bright stars, such as the stars of the 'Plough' (or 'Big Dipper') in Ursa Major, the Great Bear, result from their birth together in a single cloud of dust and gas.
A second major observational triumph
We are now in a position to describe the observations which led to a further major improvement in our understanding of the Solar System.
In 1572, Tycho Brahe, a young Danish nobleman whose passion was astronomy, observed a supernova (a very bright new star) in the constellation of Cassiopeia. His published observations of the 'new star' shattered the widely held belief that the heavens were immutable and he became a highly respected astronomer.
He realised that in order to show when further changes in the heavens might take place it was vital to have a first class catalogue of the visible stars. Four years later, Tycho was given the Island of Hven by the King of Denmark and money to build a castle that he called Uraniborg, named after Urania, the Greek Goddess of the heavens. Within its grounds he built a semi-underground observatory called Stjerneborg. For a period of 20 years his team of observers made positional measurements of the stars and, critically important, the planets.
This picture shows his observatory and indicates how his measurements were made. An observer sighted a star (or planet) through a small window on a south facing wall. He did two things. Firstly he was able to indicate to an assistant the time of transit when the star crossed the meridian. The meridian is the half-circle that runs across the sky through the zenith between the north and south poles and intersects the horizon due south. Secondly, by using a giant quadrant equipped with vernier scales he was able to measure the elevation (angular height above the horizon) of the star at the moment of transit. The assistant is standing beside the clock at the lower right of the diagram to measure the time at which the star transits and a scribe is seated at a table at the lower left who would then note the elevation of the star and time of transit in the log book. He could thus determine the position of the star on the celestial sphere.
Not only had Tycho produced a star catalogue 10 times more precise than any previous astronomer - the errors of the 777 star positions never exceeded 4 arc minutes - he had charted the movement of the planets during the 20 year period of his observations. It was these planetary observations that led to the second major triumph of observational astronomy in the 16th and 17th centuries: Kepler's three laws of planetary motion.
When King Frederik II died in 1588, Tycho lost his patron. The final observation at Hven was made in 1596 before Tycho left Denmark. After a year travelling around Europe he was offered the post of Imperial Mathematician to Rudolf II, the Holy Roman Emperor, and was installed in the castle of Benatky. It was here that a young mathematician, Johannes Kepler, came to work with him. Tycho gave him the task of solving the orbit of the planet Mars. Kepler thought that it would take him a few months. In fact it took him several years!
The Laws of Planetary Motion
From the invaluable data base of planetary positions provided by Tycho, Kepler was able to draw up his three empirical laws of planetary motion. The word 'empirical' indicated that these laws were not based on any deeper theory but accurately described the observed motion of the planets. The first two were published in 1609 and the third in 1618.
The first law states that:
Planets move in elliptical orbits around the Sun, with the Sun positioned at one focus of the ellipse.
The second law states that:
The radius vector - that is, the imaginary line joining the centre of the planet to the centre of the Sun - sweeps out equal areas in equal times.
This implies that the planets, in an elliptical orbit, move faster when closest to the Sun - as they near the Sun they lose potential energy and, as the total energy must be constant increase their kinetic energy, and so move faster.
The third law relates the period of the planet's orbit T with a, the semi-major axis of its orbit and states that:
The square of the planet's period, T, is proportional to the cube of the semi-major axis of its orbit, a. (For a circular orbit, the semi-major axis is the radius)
A highly significant result of the third law is that it enabled astronomers to make a very precise map of the solar system. The relative positions of the planets could be plotted precisely but the map had no scale. It was like having a very good map of a country but not knowing, for example, how many cm on the map related to km on the ground. A way to solve this problem would be to make an accurate measurement of onereasonably large distance across the area covered by the map. This would then give the scale, and thus the distance between any other two points on the map could be found.
Measuring the Astronomical Unit
In the case of the Solar System, the obvious measurement to make was the distance between the Earth and either of its two nearest planets, Venus or Mars. Initially this was attempted by the use of parallax: the slight difference in direction of an object when viewed from different locations. In principle the position of a planet, as seen against the backdrop of the distant stars, would be different when observed from separate locations on Earth. The problem is that the widest separation possible on the Earth ~ its diameter, 12,756 km, is small compared to the distances of the planets and thus the angular difference that has to be measured is very small and prone to errors.
In 1672 the Italian observer Cassini observed Mars from Paris whilst a colleague observed it from French Guiana in South America. They were able to measure its parallax, and hence measure the Earth-Mars distance. Using Kepler's third law they were then able to calculate the Earth's distance from the Sun and derived a value of 140 million km.
Later astronomers observed the transit of Venus, two of which occur each century. By timing, from locations all over the Earth, when Venus first entered the Sun's limb and then just before it left, one can measure the parallax of Venus and hence find its distance. The value deduced from both the 18th century transits was 152.4 million km.
Radar Measurement of the Astronomical Unit
A really accurate measurement had to wait until 1962, when powerful radars using large radio telescopes at Jodrell Bank in the UK, the USA and Russia, were able to obtain echoes from the surface of Venus. The accepted value now is 149,597,870.691 km, just less than 150 million km or 93 million miles.
The discovery of more planets
Refracting telescopes of that time were plagued with the problem of "false colour" - bright objects were rimed with colour. This is a result of dispersion in the glass that makes up the lens. Different colours of light are brought to a focus at different distances from the lens. This problem was later largely solved by using what are termed "achromatic doublets" but telescopes still had to be very long if large apertures were required. Isaac Newton did not believe that the problem could be solved and, instead, produced the "Newtonian Reflecting Telescope" in which the light forms an image by reflection at the surface of a mirror.
William Herschel was the organist at the Octagon Chapel in Bath, and became very adept at making speculum mirrors. His were better than those used by professionals at the time. As a result the images seen in his telescope were perhaps the best in the world and it was this that enabled him to see that an object that had previously been thought to have been a star showed a small "disk". He had discovered the planet that became known as Uranus.
Because Uranus had been observed, albeit unknowingly, for about 100 years it was possible to compute its orbit quite accurately so astronomers were initially surprised when it was seen to move first faster, then slower in its path around its orbit. It became apparent that it must be being gravitationally "pulled" by an unknown planet that lay beyond Uranus. John Couch Adams at Cambridge and Urbain LeVerrier at the Paris Observatory independently computed where in the sky this unknown planet should lie and it was then found by astronomers at the Berlin Observatory - so a truly international discovery. Accurate observations and improved telescopes had increased the size of the known universe!
Stellar distances
To measure stellar distances the method of Parallax is again used which requires one to observe an object from two positions some distance apart (forming a baseline) and measure the change in angle. The further away the object, the greater the baseline required. In the case of stars, there is no perceptible change in angle from points across the Earth, so a considerably bigger baseline is required. Happily, one is available to us, the distance across the orbit of the Earth around the Sun. It is the case that the majority of stars are too far away to show any change in their observed position when observed, say, in the spring and autumn when the Earth is at opposite sides of the Sun in its orbit. These stars can thus be considered as reference points against which the movement in position of (at present) a relatively few nearby stars can measured. The angular change in their position, coupled with knowledge of the Earth's orbit can thus be used to find their distance.
Galaxies and the Large Scale Structure of the Universe
On a dark night with transparent skies, we can see a band of light across the sky that we call the milky way. The light comes from the myriads of stars packed so closely together that our eyes fail to resolve them into individual points of light. This is our view of our own galaxy, called the Milky Way Galaxy or often "the Galaxy" for short. It shows considerable structure due to obscuration by intervening dust clouds. The band of light is not uniform; the brightness and extent is greatest towards the constellation Sagittarius suggesting that in that direction we are looking towards the Galactic Centre. However, due to the dust, we are only able to see about one tenth of the way towards it. In the opposite direction in the sky the milky way is less apparent implying that we live out towards one side. Finally, the fact that we see a band of light tells us that the stars, gas and dust that make up the galaxy are in the form of a flat disc.
Size, shape and structure of the Milky Way
The size of the galaxy was first measured by Harlow Shapley who measured the distances to 100 of the globular clusters associated with our galaxy. He found that they formed a spherical distribution, whose centre should logically be the centre of the galaxy, and so deduced that our Sun was ~30,000 light-years distant from it and the diameter was about 100,000 light years across. We now believe that the Sun is 27.7 thousand light-years from the galactic centre and, using spectroscopic measurements to observe its motion relative to the globular clusters, we can calculate that the Sun is moving around the centre of the galaxy at about 230 km/sec, taking ~ 220 million years to travel once around it. It appears that the central parts of the galaxy rotate like a solid body so that the rotation speed increases as one moves out from the centre. Measurements of the speed at which stars and gas rotate around the centre of the galaxy as a function of distance produce what is called the "galactic rotation curve".
Other galaxies
Galaxies, called originally "white nebulae" have been observed for hundreds of years, but it was not until the early part of the last century that the debate as to whether they were within or beyond our galaxy was settled - essentially when observations of Cepheid variables enabled their distances to be measured. They are, of course, objects outside our galaxy and can now be observed throughout the universe. Galaxies can be divided into a number of types and then the subdivided further to produce a classification scheme first devised by Edwin Hubble. As more and more galaxies were discovered, it became apparent that galaxies form groups (up to about ~100 galaxies) or clusters (containing hundreds to thousands of galaxies).
Elliptical galaxies
These, as their name implies, have an ellipsoidal form rather like a rugby ball. They range from those that are virtually circular in observed shape, called E0 by Hubble, to those, called E7, which are highly elongated. Giant elliptical galaxies may contain up to 10 million, million solar masses in a volume some nine times that of our own galaxy ~ 300,000 light-years across. These are the most massive of all galaxies but are comparatively rare. Far more common are elliptical galaxies containing perhaps a few million solar masses within a volume a few thousand light years across. Elliptical galaxies account for about one third of all galaxies in the universe.
Spiral galaxies
Like our own galaxy, these have a flattened spiral structure. The first observation of the spiral arms in a galaxy was made by the Third Earl of Rosse. During the 1840's he designed and had built the mirrors, tube and mountings for a 72 inch reflecting telescope which for three quarters of a century was the largest optical telescope in the world. With this instrument, situated at Birr Castle in Ireland, Lord Rosse made some beautiful drawings of astronomical objects. Perhaps the most notable was that, shown below,
known as the "Whirlpool Galaxy". It was the first drawing to show the spiral arms of a galaxy and bears excellent comparison to modern day photographic images. [The galaxy is interacting with a second galaxy, NGC 5195, seen at the lower left of the drawing.]
Spiral galaxies make up the majority of the brighter galaxies. Hubble classified them first into four types, S0, Sa, Sb and Sc. S0 galaxies, often called "Lenticular" galaxies, have a very large nucleus with hardly visible, very tightly wound, spiral arms. As one moves towards type Sc, the nucleus becomes relatively smaller and the arms more open. In many galaxies the spiral arms appear to extend from either end of a central bar. These are called "Barred Spirals" and are delineated SBa, SBb and SBc. Our own Milky Way Galaxy was thought to be an Sb or Sc but there is now some evidence that it has a bar so making it an SBb or SBc.
Irregular galaxies
A small percentage of galaxies show no obvious form and are classified as Irregulars. One nearby example is the Small Magellanic Cloud (SMC). Its companion, the Large Magellanic Cloud (LMC), is usually classified as one too, though it shows some features of a small barred spiral. Such small galaxies are not very bright so we cannot see too many but they may, in fact, be the most common type.
The Universe
As our telescopes look ever further out into space, we say that we are observing our universe. Assuming that the universe has an origin some time in the past, there is a limit to how far we can see due to the finite speed of light - we cannot see further that the distance light can travel since its origin. As the universe ages, this limit increases. The part of the universe that we can see is properly called the "visible universe", but this is normally shortened to simply the "universe". The whole of space, of which our universe is a part, may well extend far beyond - possible to infinity - and the totality of space is often termed the "cosmos", hence the term "cosmology" used to define the study of its origin and evolution.
The Cosmic Distance scale
To understand the scale size of the universe we need to be able to measure the distances of the galaxies. A key point in the "distance ladder" are the distances to the Large and Small Magellanic Clouds. These are a pair of irregular galaxies that are relatively close to our Milky Way galaxy. As we will see, a type of very bright variable star observed within them, the Cepheid Variables, can be used a "standard candles" to measure the distances of galaxies relative to the distances of the Magellanic Clouds. This cannot be accurate unless we first have an accurate measure of the distances of one or other of the Magellanic Clouds.
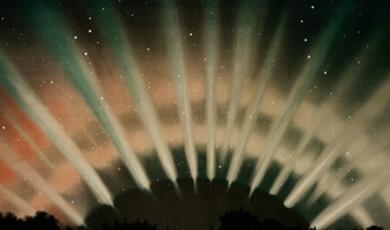
Estimates of the precise distances to the LMC and SMC has not been easy, with values varying substantially over the years. With the occurrence of SN 1987A in the LMC, scientists were given a direct method to measure the distance to the LMC. This was based on the time taken for the light emitted by the supernova to illuminate a distant ring of gas surrounding it. These important observations and the calculations based on them are described in slightly simplified form below and have resulted in an estimate of the distance from Earth to the centre of the LMC of 52.0 ± 1.3 kpc. This has given a new value for the zero point of the Cepheid distance scale, which has greatly improved our knowledge of galactic distances and, as a consequence, the value of Hubble's constant - the scale factor of the universe.
Using Supernova 1987A to measure the distance of the Large Magellanic Cloud.
Some time after the supernova was first observed, a ring of material that had previously been ejected by the progenitor star lit up as it was irradiated by ultraviolet light from the explosion. Had the ring been at right-angles to our line of sight (a), we would have seen all parts light up simultaneously and, as it would then have been at the same distance as the supernova, the number of days this was after we first saw the supernova would simply be the radius of the ring in light days, R. However, as the ring is at an angle Δ to our line of sight, we saw the nearest part of the ring brighten after 75 days and the farthest part of the ring brighten after 390 days. From Figure (b) you should see that we would have observed the nearest part of the ring brighten after a time Δn after we first saw the supernova and the most distant part brighten after a time Δf.
From the geometry and the observations one can show that it took 232.5 days for light to reach the ring , a distance R from the supernova, after the explosion.
The Hubble Space Telescope (HST) image gave an angular size for the radius of the ring of 0.86 arc seconds. This angular size and the deduced ring radius ring of 232.5 light days can be used to estimate the distance of the LMC in parsecs.
Radius of the ring = 232.5 x 3 x 105 x 3600 x 24 km= 6 x 10¹² km
(The velocity of light is 3 x 10⁵ km/s and that 1 parsec = 3.1 x 10¹³ km)
The semi-major axis of the ellipse observed by the HST will be the radius of the ring. (It is an ellipse as the ring is seen at an angle to the line of sight.)
The ring radius thus subtends an angle of 0.86 arc seconds, so the distance, D, will be given by:
D = d/Θ (where Θ is in radians)
= 6 x 10¹² / (0.86/(3600 x 57.3)) km
= 6 x 10¹²/ 4.2 x 10⁻⁶ km
= 1.4 x 10¹⁸ km
= 1.4 x 10¹⁸ / 3.1 x 10¹³ pc
= 46,100 pc
This is a somewhat lower than the "accepted" value of ~ 50,000 pc. The discrepancy is due to the fact that the ring has a thickness and its actual size is perhaps 7% greater than that calculated by the times that the near and far sides of the ring were seen to brighten - which would correspond to when the inner diameter of the ring would be illuminated by UV light rather than the outer diameter of the ring as measure by the HST. A recent very detailed analysis of the light curves which allow the ring radius to be measured more accurately give a value of the distance of SN1987A of 51.5 +/- 1.2 Kpc.
The Cepheid Variable Distance Scale
The observational basis of this distance scale was provided byHenrietta Leavitt whilst working at the Harvard College Observatory where she became head of the photographic photometry department. Her group studied images of stars to determine their magnitude using a photographic measurement system developed by Miss Leavitt that covered a 17 magnitude brightness range. Many of the plates measured by Leavitt were taken at Harvard Observatory's southern station in Arequipa, Peru from which the Magellanic Clouds could be observed and she spent much time searching the plates taken there for variable stars within them. She discovered many variable stars within them including 25 Cepheid variable stars. These stars are amongst some of the brightest; between 1000 and 10,000 times that of our Sun and are named after the star Delta Cepheus which was discovered to be variable by the British astronomer John Goodricke in 1784. These stars pulsate regularly rising rapidly to a peak brightness and falling more slowly as shown below.
Leavitt determined the periods of C Cepheid variables in the Large Magellenic Cloud and in 1912 announced what has since become known as the famous Period-Luminosity relation. She stated: "A straight line can be readily drawn among each of the two series of points corresponding to maxima and minima (of the brightness's of Cepheid variables), thus showing that there is a simple relation between the brightness of the variable and their periods." As the LMC was at some considerable distance from Earth and was relatively small, Leavitt also realized that: "as the variables are probably nearly the same distance from the Earth, their periods are apparently associated with their actual emission of light, as determined by their mass, density, and surface brightness."
The relationship between a Cepheid variable's luminosity and period is quite precise, and a three-day period Cepheid corresponds to a luminosity of about 800 times the Sun whilst a thirty-day period Cepheid is 10,000 times as bright as the Sun. So that if, for example, we might measure the period of a Cepheid variable in a distant galaxy and observe that it is 1000 times fainter than a Cepheid variable in the LMC. We can then deduce that, from the inverse square law, it would be 100 times further away than the LMC, that is 100 x 51.2 Kpc giving a distance of 5,100 Kpc (16,600 Ly). Cepheid stars are thus the ideal standard candle to measure the distance of clusters and external galaxies. (As we do not the precise location of the Cepheid variable within the cluster or galaxy there will be a small uncertainty but this error is typically small enough to be irrelevant.)
Edwin Hubble identified some Cepheid variable in the Andromeda galaxy, proving for the first time its extragalactic nature. Until this time some astronomers had argued that the so called "white nebula" were within our own Milky Way galaxy. Recently, the Hubble Space Telescope succeeded in identifying some Cepheid variables in the Virgo cluster, so enabling a determination of its distance of 18 Mpc (60 million Ly).
Groups and clusters of galaxies
Most galaxies are found in groups typically containing a few tens of galaxies or clusters that may contain up to several thousand. Our Milky Way galaxy forms part of the Local Group that contains around 40 galaxies within a volume of space three million light-years across. Our galaxy is one of the three spiral galaxies (along with M31 and M33) that dominate the group and contain the majority of its mass. M31, the Andromeda galaxy and our own are comparable in size and mass and their mutual gravitational attraction is bringing them towards each other so that in a few billion years they will merge to form an elliptical galaxy. M33 is the third largest galaxy in the group which contains many dwarf elliptical galaxies, such as the two orbiting M31. There are several large irregular galaxies such as the Magellanic Clouds and at least 10 dwarf irregulars to add to the total. There may well be more galaxies within the group, hidden beyond the milky way that obscures over 20% of the heavens.
The Coma Cluster indicates the presence of dark matter
The first evidence of a large amount of unseen matter in the universe came from observations made by Fritz Zwicky in the 1930's. He studied the Coma cluster of galaxies, 321 million light years distant, and observed that the outer members of the cluster were moving at far higher speeds than were expected. Suppose a cluster of galaxies were created which were not in motion. Gravity would cause them collapse down into a single giant body. If, on the other hand, the galaxies were initially given very high speeds relative one to another, their kinetic energy would enable them to disperse into the Universe and the cluster would disperse, just as a rocket traveling at a sufficiently high speed could escape the gravitational field of the Earth. The fact that we observe a cluster of galaxies many billions of years after it was created implies that that there must be an equilibrium balancing the gravitational pull of the cluster's total mass and the average kinetic energy of its members. This concept is enshrined in what is called the Virial Theorem so that, if the speeds of the cluster members can be found, it is possible to estimate the total mass of the cluster. Zwicky carried out these calculations which showed that the Coma Cluster must contain significantly more mass than could be accounted by its visible content.
Superclusters
Small clusters and groups of galaxies appear to make up structures on an even larger scale. Known as superclusters, they have overall sizes of order 300 million light-years (100 times the scale size of our local group). Usually a supercluster is dominated by one very rich cluster surrounded by a number of smaller groups. The Local Supercluster is dominated by the Virgo Cluster. The Virgo supercluster, as it is often called, is in the form of a flattened ellipse about 150 million light-years in extent with the Virgo Cluster at its centre and our local group near one end. In the same general direction, but further away lies the Coma cluster containing over 1000 galaxies. It is the dominant cluster in the Coma Supercluster at a distance of 330 million light-years. Two other nearby superclusters lie in the directions of the constellations Perseus/Pisces and Hydra/Centaurus at distance of 150 and 230 million light-years respectively.
The structure of the universe
Galaxies, in their groups, clusters and superclusters, extend across the visible universe, and recently it has been possible to map their distribution through space. The distribution is not uniform but appears like the structure of a sponge or a froth of soap bubbles. The galaxies are located on the surface of the bubbles or the walls of the sponge and few are found within the bubbles or the empty spaces within the sponge. These, nearly empty, regions are called voids.
The Blueshifts and Redshifts observed in the spectra of galaxies.
When the spectra of galaxies were first observed in the early 1900's it was found that their observed spectral lines, such as those of hydrogen and calcium, were shifted from the positions of the lines when observed in the laboratory. In the closest galaxies the lines were shifted toward the blue end of the spectrum, but for galaxies beyond our local group, the lines were shifted towards the red. This effect is called a "redshift" or "blueshift" and the simple explanation attributes this effect to the speed of approach or recession of the galaxy, similar to the falling pitch of a receding train whistle, which we know of as the Doppler effect. For speeds which are small compared to the speed of light, then the simple formula:
Δf/f = Δλ/λ = v/c
may be used. Here, f is the frequency, λ is the wavelength, Δf and Δλ are changes in frequency and wavelength, v is the velocity of approach or recession and c is the speed of light.
Some of the earliest observations of red and blue shifts were made by the American astronomer Vesto Slipher. In 1913 he discovered that the Andromeda galaxy had a blueshift of 300 km/s. This implies that Andromeda and the Milky Way galaxies are approaching each other due to the gravitational attraction between them but not, as might first appear, by 300 km/sec. Our Sun is orbiting the centre of our galaxy at about 220 km/second and taking this into account, the actual approach speed is nearer 100 km/sec. By 1915 Slipher had measured the shifts for 15 galaxies, 11 of which were redshifted. Two years later, a further 6 redshifts had been measured and it became obvious that only the nearer galaxies (those within our local group) showed blueshifts. From the measured shifts, and using the Doppler formula given above he was able to calculate the velocities of approach or recession of these galaxies. These data were used by Edwin Hubble in what was perhaps the greatest observational discovery of the last century, and it is perhaps a little unfair, that Slipher has not been given more recognition.
The Expansion of the Universe
In the late 1920's Edwin Hubble, using the 100" Hooker Telescope on Mount Wilson, measured the distances of galaxies in which he could observe a type of very bright variable star called Cepheid Variables which vary in brightness with very regular periods He combined these measurements with those of their speed of approach or recession (provided by Slipher) of their host galaxies (measured from the blue or red shifts in their spectral lines) to produce a plot of speed against distance. All, except the closest galaxies, were receding from us and he found that the greater the distance, the greater the apparent speed of recession. From this he derived "Hubble's Law in which the speed of recession and distance were directly proportional and related by "Hubble's Constant" or H0. The value that is derived from his original data was ~500 km/sec/Mpc. Such a linear relationship is a direct result of observing a universe that is expanding uniformly, so Hubble had shown that we live within an expanding universe. The use of the word "constant" is perhaps misleading. It would only be a real constant if the universe expanded linearly throughout the whole of its existence. It has not - which is why the subscript is used. H0 is the current value of Hubble's Constant!
Consider the very simple one dimensional universe shown in Figure (a). Initially the three components are 10 miles apart. Let this universe expand uniformly by a factor of two in one hour to give the situation as in (b). As seen from the left hand component, the middle components will have appeared to have moved 10 miles in one hour whilst the right hand component will have appeared to move 20 miles - the apparent recession velocity is proportional to the distance.
If one makes the simple assumption that the universe has expanded at a uniform rate throughout its existence, then it is possible to backtrack in time until the universe would have had no size - its origin, known as theBig Bang - and hence estimate the age, known as the Hubble Age, of the universe. This is very simply given by 1/H0 and, using 500 km/sec/Mpc, one derives an age of about 2000 million years:
1/H0 = 1 Mpc / 500 km/sec
= 3.26 million light years/ 500 km/sec
= 3.26 x 106 x 365 x 24 x 3600 x 3 x 105 sec / 500
= 3.26 x 106 x 3 x 105 years / 500
= 1.96 x 10⁹ years = ~ 2 Billion years
A problem with age
This result obviously became a problem as the age of the solar system was determined (~4500 million years) and calculations relating to the evolution of stars made by Hoyle and others indicated that some stars must be much older than that, ~ 10 to 12 thousand million years old. During the blackouts of World War II, Walter Baade used the 100" telescope to study the stars in the Andromeda Galaxy and discovered that there were, in fact, two types of Cepheid variable. Those observed by Hubble were 4 times brighter than those that had been used for the distance calibration, and this lead to the doubling of the measured galaxy distances. As a result, Hubble's constant reduced to ~250 km/sec/Mpc. There still remained many problems in estimating distances, but gradually the observations have been refined and, as a result, the estimate of Hubble's constant has reduced in value to about 72 km/sec/Mpc. One of the best determinations is that made by a "key project" of the Hubble Space Telescope that observed almost 800 Cepheid variable stars in 19 galaxies out to a distance of 108 million light-years.
Combined with some other measurements they derived a value of:
H0 =72+/-8 km s-1 Mpc-1.
The age calculated from a value of Hubbles's Constant of 72 is the order of 14 billion years - very close to the value we currently believe of 13.6 billion years. The agreement is a little surprising in that it is based on a constant rate of expansion. We know that this is not the case. It appears the universe's expansion rate was reducing up to about 4 billion years ago, but the expansion rate has since been increasing - the effects have roughly cancelled out giving the approximately the same age as if the expansion had been constant.
The Cosmological Redshift
In the section above, the blueshift and redshift were regarded as being due to the Doppler effect, and this would be perfectly correct when considering the blue shifts shown by the galaxies in the local group. However in the cases of galaxies beyond our local group there is a far better way of thinking about the cause of the redshifts that we see. As Hubble showed, the universe is expanding so that it would have been smaller in the past. In addition it is not right to think of the galaxies (beyond the movements of those in our local group) moving through space but, rather, that they are being carried apart by the expansion of space. A nice analogy is that of baking a current bun. The dough is packed with currents and then baked. When taken out of the oven the bin will (hopefully) be bigger and thus the currents will be further apart. They will not have moved through the dough, but will have been carried apart by the expansion of the dough.
When a photon was emitted in a distant galaxy corresponding to a specific spectral line, the Universe would have been smaller. In the time it has taken that photon to reach us and the photon has traveled through space, the universe has expanded and this expansion has stretched, by exactly the same ratio, the wavelength of the photon. This increases the wavelength so giving rise to a redshift that we call the "Cosmological Redshift". A simple analogy is that of drawing a sine wave (representing the wavelength of a photon) onto a slightly blown up balloon. If the balloon is then blown up further, the length between the peaks of the sine wave (its wavelength) will increase.
The Cosmic Microwave Background
It was the American physicist, George Gamow, who first realised that the Big Bang should have resulted in radiation that would still pervade the universe. This radiation is now called the "Cosmic Microwave Background" (CMB). Initially in the form of very high-energy gamma rays, the radiation became less energetic as the universe expanded and cooled so that by a time some 300 to 400 thousand years after the origin the peak of the radiation was in the optical part of the spectrum. Up to that time the typical photon energy was sufficiently high to prevent the formation of hydrogen and helium atoms and thus the universe was composed of hydrogen and helium nuclei and free electrons - so forming a plasma. The electrons would have scattered photons rather as water droplets scatter light in a fog and thus the universe would have been opaque. This is thus as far back in time as we are able to see. At this time the universe had a temperature of ~ 3000K. Since that time, the universe has expanded by about 1000 times. The wavelengths of the photons that made up the CMB will also have expanded by 1000 times and so will now be in the far infrared and radio part of the spectrum. The effective black body temperature of this radiation will have fallen by just the same factor and would thus now be ~ 3K.
The Discovery of the CMB
Radio astronomers Arno Penzias and Robert Wilson serendipitously discovered this background radiation in 1963, but incontrovertible proof as to its origin had to wait until 1992 when the COBE satellite was able to show that the background radiation had the precise black body spectrum that would have been expected. It is worth telling a little of the Nobel Prize winning story of its discovery. Penzias and Wilson had been given use of the telescope and receiver that had been used for the very first passive satellite communication experiments using a large aluminum covered balloon called "Echo". It had been designed to minimise any extraneous noise that might enter the horn shaped telescope and the receiver was one of the best in the world at that time. They tested it thoroughly and found that there was more background noise produced by the system than they expected. They wondered if it might have been caused by pigeons nesting within the horn - being at ~ 290 K they would radiate radio noise - but having removed them there was no substantial difference. The excess noise remained the same wherever they pointed the telescope - it came equally from all parts of the sky. Finally they learnt the excess noise was not caused within their horn antenna or receiver but that their observation agreed exactly with predictions that the universe would be filled with radiation left over from the Big Bang. The average temperature is 2.725K.
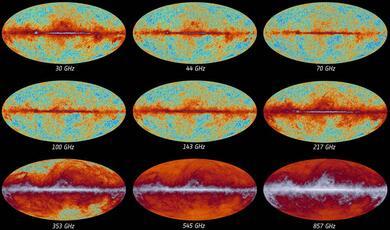
The "ripples" in the CMB.
Observations by the COBE spacecraft first showed that the CMB did not have a totally uniform temperature and, since then, observations from the WMAP spacecraft, balloons and high mountain tops have been able to make maps of these so called "ripples" in the CMB - temperature fluctuations in the observed temperature of typically 60 micro Kelvin. The small temperature fluctuations were the result of concentrations of "dark matter" that formed the seeds upon which the galaxies formed. The fundamental point is that we now know very accurately what the universe was like 380,000 years after its origin!
Extending the Distant scale further across the Universe
In the 1990's it became possible to measure the distance to very distant galaxies. We can estimate the distance to remote objects if we have what is called a standard candle - an object of known brightness some of which have been observed at known distances nearby. As we have seen, Hubble used such a technique to measure the distances of galaxies using Cepheid variable stars of known peak brightness. These had first been observed in the Magellanic Clouds at a known distance from us. Suppose a Cepheid variable is observed in a distant galaxy and appears 10,000th as bright as a similar Cepheid in the SMC. Assuming no distinction by dust it would, from the inverse square law, be at 100 times the distance of the SMC.
But, though Cepheid variable stars are some of the brightest stars known, there is a limit to distances that can be measured by them. Something brighter is required. For a short time after they explode, supernovae are the brightest objects in the Universe and there is one variant, called aType 1a supernova, that is believed to have a uniform peak brightness. It might be useful to consider an analogy. Imagine a ball of plutonium of less than critical mass. If one then gradually added additional plutonium uniformly onto its surface it would, at some point in time, exceed the critical mass and explode. The power of this explosion should be the same each time the experiment is carried out as a sphere of plutonium has a well defined critical mass.
A type 1a supernova occurs in a binary system. The more massive star of the pair will evolve to its final state first and its core may become a white dwarf about the size of the Earth. Later its companion will become a red giant and its size will dramatically increase. Its outer layers may then be attracted onto the surface of the white dwarf whose mass will increase. At some critical point, when its mass nears the Chandrasekhar limit of roughly 1.44 times the mass of the Sun, the outer layers will ignite and in the resulting thermonuclear explosion the entire white dwarf star will be consumed. As all such supernova will explode when they reach the same total mass, it is expected that they will all have similar peak brightness's (about 5 billion times brighter than the Sun) and should thus make excellent standard candles.
Because type Ia supernovae are so bright, it is possible to see them at very large distances and can be seen about 500 times further away than the brightest Cepheid variables corresponding to a distance of around 3000 million light years - a significant fraction of the radius of the known Universe. However supernovae are rare with perhaps one each 300 years in a typical spiral galaxy. Observations are now observing thousands of distant galaxies on a regular basis and sophisticated computer programs look for supernovae events. Once initially detected, observations continue to look for the characteristic light curve of a type 1a supernova which results from the radioactive decay of nickel-56 first to cobalt-56 and then to iron-56.
To astronomer's great surprise, it appears that the supernova (and the galaxies in which they arise) are more distant than would have been expected if the expansion rate of the universe were reducing in time as was expected. It appears that the vacuum of space can itself expert a pressure - a form of anti-gravity. This energy is called Dark Energy and this appears to be making the universe expand at an ever increasing rate.
We now have surveys of galaxies within the universe which tell us about the structure of the universe today. It is rather like a sponge with the galaxies concentrated around 'voids' - vast regions of space containing virtually no galaxies.
Computers are able to make simulations of the evolution starting from its structure as observed in the CMB and ending up at the present day. The simulations can vary the amount of normal matter, dark matter and dark energy and include Hubble's Constant and the observations of the Type 1a supernova. The simulations reveal that only 4% of the mass/energy is in the form of normal matter that makes up the stars, planets gas and dust. It appears that about 23% is in the form of dark matter with the remainder, about 73%, being the mysterious dark energy.
For the first 9 billion years, gravity was slowing the expansion of the universe but, all this time, the volume of space with its attendant dark energy was increasing, and about 5 billion years ago this overcame gravity so that, since then, the rate of expansion has been increasing. It appears that this will continue at an ever faster rate so that galaxies that we can see now near the edge of the visible universe will be carried beyond our horizon and the universe will appear to become emptier and emptier.
Astronomy will not be nearly so interesting in the far future so now is a great time to be an astronomer!
©Professor Ian Morison, Gresham College, 26 October 2007

This event was on Fri, 26 Oct 2007
Support Gresham
Gresham College has offered an outstanding education to the public free of charge for over 400 years. Today, Gresham plays an important role in fostering a love of learning and a greater understanding of ourselves and the world around us. Your donation will help to widen our reach and to broaden our audience, allowing more people to benefit from a high-quality education from some of the brightest minds.