Login
Login
The afterglow of the Big Bang

Share

- Details
- Text
- Audio
- Downloads
- Extra Reading
Is there an 'echo' of the big bang? The story of the prediction, serendipitous discovery and interpretation of the microwave radiation left over from the hot early beginnings of the universe. This radiation contains a wealth of information about the history and structure of the universe. It tells us its shape. It reveals the nature of the small lumps that eventually turned into galaxies. It tells us how fast we are moving. It events tells us about irregularities which no longer exist. In recent years there have been spectacular space missions to map this radiation with unprecedented accuracy and in the next year a new European PLANCK mission will be launched.
Download Text
The afterglow of the Big Bang
Professor John Barrow
With that remarkable foresight for which Gresham professors are renowned, today’s lecture happens to be about the subject for which the Nobel Prizes in Physics were awarded about five or six weeks ago! Of course, the titles of these lectures were planned many, many months ago, but it was a reasonable guess that the Nobel Prize in Physics might go to the area of cosmology this year.
The area of cosmology in question is the radiation which is left over, apparently, from the hot early beginnings of the universe; the radiation that is usually called the microwave background radiation or the cosmic microwave background radiation. I want today to tell you a number of the features of this radiation, why we believe it is coming from the beginnings of the universe rather than being made somewhere in the solar system or nearby in our galaxy, and how we can use that radiation to tell us all sorts of unusual things about the universe.
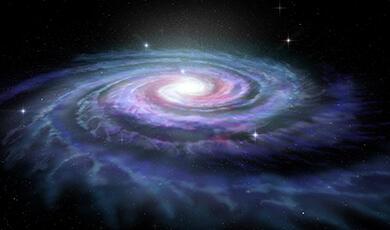
First of all, radiation more generally… If you look at different pictures of the Milky Way, that long, thin, milky strip in the sky, in different wave bands, you can see gamma ray observations, and what you are really seeing are very high energy events in the distant galaxy, so you get one view of what is going on. If you were to take x-ray pictures of the Milky Way, then you would capture the places where it is very hot, where the temperature is millions of degrees, and so you would get a different picture of what the Milky Way looks like. As you move up through the different parts of the infrared, you would be looking at the places where the young stars are forming, where there is very hot energetic activity.
If you look at minutiae from molecules, like carbon monoxide, then you can trace the distribution of molecular gas in the galaxy, and get a different snapshot of what the galaxy looks like. You could see longer wave lengths, in the radio bands, and the most interesting radio radiation of all is the so-called 21-centimetre radiation emitted by atomic hydrogen. This is a transition that is very, very slow, you never see it in a laboratory, but it can be seen in astronomical systems where there are huge numbers of atoms; so even though the transition rate is fantastically slow, that is outweighed by the number of atoms that there are undergoing the transition. I have here a map of atomic hydrogen in the galaxy, and it also shows all the rest of the radio radiation.
So the galaxy looks different if you picture it with radiation on different wave bands, and that variation of the picture, the object, as you go from one wave band to another is usually called the spectrum. The spectrum is the pattern of energy or intensity versus the wavelength or the colour of the radiation.
You can ask a very basic question: what is the spectrum of the whole universe? So what is the dominance of the radiation that is about in the universe? Is it infrared radiation, is it x-rays, is it something else?
If you view a picture that compiled from all the observations one has, you would see there is a dominant form of energy in the universe, which is radio radiation, radio frequency, and this radiation is what we are going to talk about today: radiation which is the dominant form of photons in the whole universe. Where does it come from?
The story of the radiation and what it does requires that we just have a quick resumé of the expanding universe, something that we have looked at on several occasions in this lecture series: the so-called Big Bang evolution of the universe; a measure of the size of the universe, the separation of distant clusters on the sky, and time, measured in units of billions of year. As the universe expands, its size increases with time, along some trajectory. We are about 13.7 billion years after the apparent start of the expansion. The point of the expansion, the impact it has on the universe, is that it is continuously changing the conditions within the universe. If you have a ball of radiation in a big balloon and you expand the size of the balloon so its volume increases, then the temperature of the radiation inside will decrease. In fact, the temperature will fall inversely as the diameter of the balloon. What is happening in effect, if we think of the radiation being like waves of energy, the expansion pulls the waves so the wavelengths become increased, increased wavelengths means lower energy and the radiation becomes redder in colour.
So the expanding universe today, as we know, is rather benign; it is very cool, it is very dark, it is rather spaced out in terms of distance between galaxies and stars within galaxies, but if we were to run the universe backwards in time to when it was about a thousand times more compressed than today, we would find that the temperatures would be so high that there could not be any atoms or molecules at all. There would be no stars. There would be no galaxies. It would be a completely different place; much less interesting. There is no structure in it, just a collection of electrons and photons, elementary particles and very light nuclei.
Back to the time about two or three hundred thousand years after the apparent start, if you follow it forwards from there, it slowly cools off. At first, it gets cool enough for the first atoms to form, and then simple molecules of hydrogen and so forth, and then galaxies form. Because some parts of the universe are expanding a bit more slowly than the average, they gather more material to them because of their stronger gravitational pull, and eventually they stop expanding along with everything else and they contract back and condense and form structures like the Milky Way. Within them, stars form, and planets, and life and complexity on the surface of planets. We have discovered about 180 planets around other stars now, so we know that solar systems, planetary systems, are common phenomena in the universe. It is this scenario of the expanding universe, which was hotter and denser in the past and will be cooler and more rarefied in the future, that cosmologists were confronted with first in the 1930s and the 1940s.
In 1948, a new type of cosmology was suggested by Fred Hoyle, Hermann Bondi and Tommy Gold which was called the steady state universe, and that had a different structure in one respect. It was still an expanding universe, but the rate at which the density of the universe was falling off because of the expansion was imagined to be counterbalanced by a continuous creation of atoms and material at exactly the right rate to make sure that the density is always constant. The steady state universe did not have a hot, dense past; it was always the same average looking universe, the same temperature and the same average structure, so there is a big difference between these theories.
In 1948, Ralph Alpher and Robert Herman, two American physicists, first predicted that, if we have a universe of this Big Bang sort, then there ought to be heat radiation left over from the hot beginnings. Like in any explosion, if you come back later on, you should find some debris, some radiation fallout from the explosion. In a paper to Nature, Alpher and Herman predicted that this radiation ought to have a temperature of about five degrees above absolute zero roughly today. This prediction was forgotten about, not noticed by many people – communications were not quite what they are today in 1948 in the scientific world. People were interested in other questions. It was not long after the Second World War, and astronomical attention was focused very much on the steady state theory.
What then happened is an interesting, ongoing story. If one looks at the type of arguments that Alpher and Herman first made and others continued, you must ask yourself what is going to happen if you have radiation in the universe and you have ordinary material like atoms? The interesting feature is that if you follow the size of the universe and look at how the density of the different forms of material change, then ordinary matter just falls down inversely with the volume. You have a fixed mass, the density is the mass divided by the volume, so as the volume of the universe expands, the density falls. Volume is proportional to size cubed.
Radiation behaves differently. So if you have the mass of energy also in your plot, which is expanding, the density is falling like one over the volume, but the wavelength is being increased in proportion to the size of the box’s expansion, so the density of radiation falls like one over the size to the power four. It falls more rapidly.
So if today you have less radiation in the universe than matter, and you trace things backwards in time, you will find that you will reach a point where the radiation density was equal to that of the ordinary matter, and before that time the radiation density would be greater. Today, we find that the density of matter is about 2,000 times the density of radiation in that radio band where it peaks, and so if we follow backwards in time, we will find a crossover at a time when the universe was about 10,000 times more contracted than the present and where the temperature was about 10,000 times greater than it is today. This earlier period, where the radiation dominates, is usually called the Radiation Era.
If we look at this in a different way, with our satellite flying around the Earth, as we look out into space, with greater and greater distances, we are really looking backwards in time, because radiation takes time to reach us. When we see a very distant star or galaxy, we are seeing it as it was in the past when the light left, maybe a billion years ago. So astronomy is like a time machine: we see the universe as it was when light left these distant sources.
Near by, you would see things that are relatively close, where the light left not that long ago. Maybe millions or up to one billion years ago you would see distant galaxies. If we keep looking further back, we expect to encounter a period where we really do not see very much at all, because we are looking back to before the stars were formed, so there is nothing bright to see. If we keep going and we look in the radio band, then we eventually start to reach a period where the densities of the matter and the radiation are the same, and it is at that epoch, or just afterwards, that radiation starts to fly freely towards us. Before that, it scatters off electrons and other material and the universe is opaque, you cannot see through it.
When we look at the sky with our radio telescopes and satellites and look for this background radiation, if we see it, what we are seeing is the state of the universe at the time when the radiation started flying freely towards us, when the universe was about 300,000 years old. This radiation was discovered, serendipitously, in 1965 by two Americans, Arno Penzias and Robert Wilson. These two gentlemen were radio engineers working for the Bell Telephone Laboratories in the USA. I will say the Bell Telephone Laboratories is a very impressive company. The British telephone company has enormous difficulty in connecting your telephone call, but the American telephone company discovers the origin of the universe! Bell Telephone Company had a tradition of supporting basic research and had one of the world’s finest physics laboratories. They developed receivers. What the receivers were very much about, and what these people’s work was about, was finding ways to track the echo communications satellite, so this research work was certainly to do with telecommunications.
In calibrating an enormous horn-shaped radio detector, they collected radiation coming towards it. As the Earth rotates each day, the direction it looks at in the universe also changes. Well, they had a puzzle which they grappled with for a long time. Their instrument kept receiving a very, very low level noise, with pretty much the same intensity from every direction. Nobody else had seen this because their detector really was the most sensitive radio detector that had ever been built. It was not possible for anyone else to have seen this. They could have just said, “Well, there must just be something wrong with the instrument,” or “Just forget about it,” but they were very, very persistent in trying to understand this noise and explored every conceivable source, including pigeon droppings, which I remember was a famous problem inside the horn. They found pigeons nesting inside, and in their published paper, they describe very delicately the analysis of dielectric materials found deposited within the horn!
After a huge amount of investigation, they really remained confident that they were seeing something real, and it was not something that changed with a daily cycle or a monthly cycle, so they felt fairly confident it was produced locally – it was not the local radio station or something like that. Eventually, they published their discovery, with a very low key title: “The discovery of excess antenna temperature at particular frequency.” But in the process of publishing that, they discovered down the road, at Princeton, there was a research group led by Robert Dicke that was planning to build a detector to search for the radiation left over from the Big Bang. They did not know about Alpher and Herman’s prediction. They had re-discovered this for themselves, were reinventing the wheel, and decided that they should build an experiment to go and look for this radiation. Dicke’s group immediately realised that what Penzias and Wilson had discovered was the radiation that they were looking for, and subsequently they realised that Alpher and Herman had predicted. So by this strange sequence of events in 1965, it was recognised that the radiation left over from the hot beginnings of the universe had been discovered, and all of a sudden the steady state universe ceased to be interesting; it could not explain this radiation, among various other things. That is when the study of the Big Bang Theory really began in earnest. Penzias and Wilson subsequently received the Nobel Prize for that discovery. Penzias went on to become the Director of Bell Laboratories.
This radiation was then explored by many other people, who tried to map it at different frequencies and determine other properties of it, and the crucial pictures of the radiation which I am going to refer to today, and tell you about their significance, are listed here.
One is that it has a very high entropy, or very high heat content. Your first reaction, if you were a sceptic and you were someone like Fred Hoyle, would be to ask, how do you know this radiation is not just made by lots of stars near by? How do you know it has got anything to do with the Big Bang beginning of the universe? Maybe it is just the integrated collection of all the radiation from everything that is around in our galaxy and beyond?
The second thing that you can start to investigate is whether the radiation could have been made locally, so is there something about it that says it has to come from far away and long ago?
The third property that was soon discovered, in 1967, is that the radiation has a fantastically high degree of isotropy. That means if you measure the temperature in one direction and then in another, you find the temperature and the intensity is the same in every direction to very high precision. In 1967, it was known that the precision was better than one part in 1,000. Today we know, as a result of recent satellite observations, that the level at which it is isotropic is one part in 100,000, so it is telling you the universe is expanding at the same rate in every direction to that precision.
If this is really heat radiation left over from the beginning of the universe, it ought to have the special spectral shape of pure heat radiation.
Lastly, although it is highly isotropic and very smooth, there must be some little lumps and bumps and variations in it, because there are lumps and bumps and variations in the universe – there are galaxies in some places and not others – and so the differences in the density of matter from place to place in the universe ought to be reflected in this radiation. So as the radiation has passed through these galaxies, and as the radiation was associated with the little seed fluctuations from which the galaxies formed, the radiation ought to contain some imprints of those seeds.
What about this problem of the entropy? If we measure the radiation of temperature – we can do that to fantastic precision today – it has a temperature of 2.725 degrees above absolute zero, and roughly about 400 photons in every cubic centimetre of the universe from this radiation. If you compare that with the density of atoms and protons in the universe, the density of protons is about one in every cubic metre, on average. Change the units around, what you are seeing is that there are about two billion photons for every proton in the universe, so this is a sort of magic number that characterises the universe. It is a pure number, so you could imagine another universe where this number was 1,000, or a billion billion, but that would not be our universe. So in our universe, it is defined by this particular number. You might wonder, if you stopped people on the street and showed them this number, “Is this a big number? Is it a small number?” Well, by the standards of physics and what goes on in the universe, this is a big number. If you responded to the challenge that this radiation might be produced by all sorts of exploding stars and things round about in the universe, no exploding stars can generate this number of photons for every proton, so this is a huge amount of radiation energy per atom or proton. There is no known source or collection of sources in the universe that can generate anywhere near this number of photons per proton, so that is the first tell-tale sign that this is not something that can be the residue of events in stars and galaxies.
This number has another remarkable significance. If we go backwards in time, right to when the universe was perhaps about a microsecond old, it is much, much smaller, it is much, much hotter, it is so hot that there cannot be protons any more, then you can ask where did that number come from? Well, the 10 to the 9 photons to the proton is a residue on a situation where, in effect, there were one plus a billion photons for every billion anti-protons, or anti-particles. When the temperature cooled below the temperature energy of a proton, then the billion anti-protons knocked out the billion protons to make two billion photons for every one left over proton. So that magic number of two billion photons per proton is a reflection that the universe had a sort of lopsided early structure. It had just a little bit more matter compared with antimatter, so that when the antimatter annihilated, it left over just one proton for every billion photons, two billion photons, made from the annihilations.
If you tried to have a universe where there were equal numbers of protons and anti-protons, a beautifully symmetric universe where matter and antimatter were equal, and you calculate what happens when all the annihilation takes place, you end up with 10 to the power 18 photons per proton, so a billion billion photons per proton. That is not the universe that we live in, and so we can say that that shows you that the universe could not have begun with equal amounts of matter and antimatter. We understand, incidentally, how that little asymmetry did develop, but that is really a story for another lecture!
One of the great challenges, with the background radiation, was to confirm that it really was heat radiation. This was another way of confirming that it did not arise locally. The trouble with doing this from the Earth was that if you try to measure radiation in these wavebands through the Earth’s atmosphere, there is a lot of distortion in the spectrum because of molecules like water, which absorb the radiation and then re-emit it in a slightly different frequency, and so you really did have to get above the Earth’s atmosphere. The first time that was done was by the COBE satellite, at the end of the 1980s/1990, and the instrument that was designed to do that was called FIRAS, the Far Infrared Spectrophotometer, that was designed by George Smoot and his large team. Smoot was one of the people who received the Nobel Prize in this field with Mather. The data that came from the observations in that satellite was extraordinarily impressive.
I have a slightly modernised picture of the spectrum that they discovered, showing the intensity, the wavelength, a solid curve which is the characteristic shape of pure heat radiation, the so-called Planck Spectrum, and with a temperature of 2.725 degrees, what is usually called a black body radiation, a spectrum of radiation emitted by a perfect black body.
The data points give a very good agreement. The agreement is far, far better than you might ever imagine. You have probably never seen experimental points of error bars on a picture in science where the error bars are 400 sigma. If you work in engineering or biology or even physics, social sciences, you might use 2 or even 3 sigma. Eddison, you might have 3, 4 sigma. By those standards, if you imagine what the uncertainties are in these data points, they are 100 times smaller than the thickness of the line that has been drawn, so they are unrepresentable. This is the most accurate heat spectrum that has ever been observed in nature anywhere; there are no distortions in the spectrum of any discernable sort.
This was something of a surprise when it was announced at a famous American Astro-Physical Society meeting. Everybody stood up and applauded as soon as they saw the spectrum come up. It was telling you that the universe has really been extremely quiet in many respects in the past. When this spectrum formed, there had not been enormous violent explosions that distorted the spectrum.
The most important thing that it tells you about the hot beginnings of the universe is that this radiation was emitted or it flies towards us from an epoch in the past that was hot enough and dense enough to relax it into this pure heat spectrum form. So if the radiation was made nearby, locally, or came from different sources, it would not have the pure heat spectrum, because it would not have been made in conditions where the temperature was greater than 10,000 degrees with correspondingly high densities. This thermal spectrum is a key feature of this radiation.
There is a little-known and remarkable set of observations which you can gather up which give a further test of the pedigree of this radiation. You will remember I said that as the universe expands, the radiation cools, and the temperature falls inversely as the size of the universe. Astronomers have a way of measuring the size; they call it the red shift. If the size today is A zero and the size at some time in the past is A, then the ratio of the two is one plus this quantity called the red shift. So the red shift is the amount by which the wavelength is being shifted on the radiation. At a time where the universe is half as big as today, this number would be equal to two and the red shift would be equal to one.
It is remarkable that as this radiation comes towards us through space from far away and long ago, it passes through collections of atoms and molecules that have particular energy levels for their electrons to sit in. If you look at the right atoms, then as the radiation comes through, it might have just enough energy to kick an electron out of one level, but not enough to kick it out of another. So you know that the energy of the radiation must be intermediate between the defining levels of those two atomic energy levels. By looking at molecules you can see at different ratios what the temperature of the radiation could have been, so it could not have been higher than something, it could not have been lower than something, otherwise there would not have been the transition. It could not have been higher than something, otherwise there would have been a transition.
If you do this, you get a rather pretty set of results, showing the temperature of the radiation, the red shift, where the universe is half as big as today, when it is a third as big, when it is a quarter as big. By seeing what levels are present and what are not present, you can figure out what the temperature of this radiation would have been at different times in the past. You can predict if the universe is expanding in exactly the way you expect, and you can see, rather beautifully, that radiation was present. Radiation does follow exactly the temperature track that you would expect it to follow as you look back in time in the recent past.
I mentioned earlier that the radiation has this remarkable property of being isotropic; that is if you look from one direction to another, you will find that the temperature is the same. Remarkably, this tells you also that the radiation cannot be made locally. You see, if you produce radiation from, say, a million sources, a million exploding stars nearby, they would have to be sources that you could not see in any other way because we do not see them. Suppose they are hiding in some way, and we do not detect them, if you are making the radiation by having a million sources, then there always has to be some statistical variation in what the intensity would be from one direction to another. We know what the smallest level of this variation would have to be, from simple statistics: it is one over the square root of the number of sources involved. So if there was a million of them, you would have one part in a hundred fluctuation as the lowest that you could possibly allow. When you allow for the distances and what the observed isotropy is, the level of isotropy in this radiation is so high that you would require an enormous number of sources to keep it so low, more sources than you can accommodate in the entire visible universe, and they all have to be invisible in every other way, so this is not credible. This is another interesting observation, that this radiation cannot be local, that it is indeed, as we suspected, coming from the beginnings of the expanding universe.
The first great discovery was its existence, its high entropy, its spectrum. The next great discovery that was made about this was a rather unusual property. Smoot, with Mather and another team, were involved in this much, much earlier – this is back in the 1980s, when I was a post-doc at Berkeley, that these experiments were done. The idea is the following.
If you imagine that we are sitting at the centre of a circle, with the universe around us, and as we look outwards, nearby we see some stars, and then we see some galaxies. As we keep going, we eventually see this epoch in the past where the radiation is starting to fly towards us. If you think of us located right at the centre, and you imagine receiving, say, the same intensity of radiation from every direction, that is the radiation would be isotropic. But, compared to this frame from which the radiation comes, we are actually moving. You know, we are not sitting at the centre. The Earth goes around the Sun, the Sun moves around the galaxy. So we and our receivers are actually moving compared to this radiation field coming from far away.
You can think of this as a bit like running in the rain. If the rain is falling vertically downwards and you run in that direction, you are going to get wetter on your front than you are on your back, so you sweep up more raindrops on your front than on your back. And a similar situation here, that if our net velocity is in this direction, compared with where the radiation is coming from, we ought to see a greater intensity, we ought to see it is hotter in that direction, and we ought to see that it is coolest in the direction 180 degrees away. This famous prediction, dating from 1967, was something that was a challenge for observational astronomers to see.
The way Smoot and Co. attempted to see it was rather fascinating. They used high flying U2 spy aircraft in the US, which had been decommissioned. This I think was the sort of aircraft that Gary Powers had caught flying around over the Soviet Union long ago. These are very strange looking things. They look like gliders with enormous wingspans, so that they are extraordinarily stable, and that was why these aircraft were required. You wanted an extremely stable platform on a high flying aircraft on which to make very delicate measurements. The trouble was that you had to fly these aircraft not only over the United States but over some countries in the Southern Hemisphere, because you wanted coverage there, and there were many countries that would not allow a U2 aircraft to fly anywhere near their border, because they were suspicious that there was something on board other than an astronomical experiment. It also required the pilots to be extremely expert in the science and the technology that went into detectors, so they had to do things in real time to optimise the experiment. Well, the experiment was a great success. The aircraft did indeed fly over different countries. Lima, Peru was one in the south, different parts over the south Atlantic, as well as the United States.
I have a picture of the result. It is a map of the temperature differences around the sky. The sensitivity with which the instruments are searching is a milli-Calvin, so you are looking for a one part in a thousand difference in the temperature from one direction to another. You have got 2.7 degree radiation on average, and you are looking for a variation in the third decimal place around the sky. What was found is that there is a hot-spot in the direction of the constellation of Leo. So we are all heading towards Leo. The observations then, and now they are much more accurate, are really rather striking, because what they found is that our overall velocity is about 300 kilometres per second. I think 380 was our net speed in that direction. But the observations could see even the little variation at the level of 30 kilometres per second which corresponds to the orbit of the Earth around the Sun, so you could actually detect the Earth’s orbit around the Sun by mapping the variation in temperature of the Big Bang heat radiation from one direction to another.
That mapping itself shows you just the temperature profiles, but if you look at the predictions, this sort of running in the rain effect, how do you expect it to vary? If that is the direction where it is hottest, what should you see if you move at some angle away from that? It is going to be cooler, but how does it change?
Well, this is something you can predict rather simply. If this is the temperature in the direction of the maximum, then as you move away from it by an angle of theta, if we are moving at a speed V, in units of the speed of light, then we should see a variation that has a cosine change as we increase the angle. That is what was being looked for, what became known as the Great Cosine in the Sky. Smoot and Mather discovered, rather beautifully, the Great Cosine in the Sky. The results showed the temperature differences between the hottest and where you are looking at in milli-Calvin, a thousandth of a degree, and then the angle between the direction you are looking and where it is at maximum. The red curve is the cosine from trigonometry, and there are the data points that were seen by the U2. This, at the time, was very convincing evidence that we had detected the first variation in this radiation from one direction to another.
There is a deep significance, because if this radiation had been produced locally by mysterious objects in stars and galaxies nearby, it would share their motion. The fact that we had detected that we were moving relative to it at this enormous speed meant that it was originating far away in space and time.
What is making us move there is not a great mystery. We are moving in the direction of a very, very large super-cluster, a big collection of clusters and galaxies, and our vicinity is simply feeling its gravitational pull and we are moving off in that direction. So although it does not feel like it, at this moment, you are moving at 380 kilometres per second relative to this radiation in the universe.
This distortion of one direction to another was just part of the story. It was the first time that people had found a difference in the radiation temperature from one direction to another. You could ask, would you expect there to be any other differences? There might not be. So if you we are saying, well, what should the temperature be if you look at an angle, theta, in the sky, there is the average temperature, there is the temperature variation because of this Great Cosine in the Sky, what is the next thing you could look for?
The next thing is predicted to have a sine squared theta variation, and that arises if the universe is expanding at a different rate in one direction to another. So if the universe is rotating, like the Earth is – the Earth is slightly flatter at the poles – then that would create radiation coming from two directions in the universe, where there is a sort of flattening, as being hotter than the radiation coming orthogonally away. Similarly, if the universe is just distorted, just expands at a different rate in one direction to another, you would see this same type of variation. What has been discovered, subsequently, is that the next order of fluctuation is much, much smaller. It is about 10 to the minus part 5 in 100,000. It does not seem to be due to the universe having some systematically different expansion in different directions; it is just caused by all the little lumps and bumps of things like galaxies and clusters, all the little irregularities that they create. They add up to produce an overall fluctuation at that sort of level. So the universe is fantastically smooth and uniform.
What would the maps look like? At first, we were confined to the ground in trying to map those little variations in the temperature from one direction to another to find the size of that cube factor. A typical observational scenario showed a rather picturesque display of results. When you are confined to the Earth, and you want to do radio astronomy here, in millimetre/centimetre wavelengths, you want to be very dry. You do not want water in the atmosphere, so you are not doing these observations very effectively at Jodrel Bank in Cheshire for example, or in Cambridge. The driest place on Earth, the best place to do radio astronomy, is the South Pole. The water vapour content is extraordinarily low and, by a strange twist, the large ozone hole in the atmosphere is ideal for radio astronomy.
The Boomerang mission has a high flying balloon which has an enormous sort of a trail carriage, and this detector would fly, it would go on a circuit of a few miles. It would be in the air for some relatively short time, and its detector would then return to Earth. Imagine that you took the map of the radio wavelength sky, these microwave bands, that was measured by this balloon and superimposed it on the real sky. If we had microwave sensitive eyes, with the sensitivity at the micro-Calvin level I think – or milli-Calvin – you would see the contours of variation in temperature, hotter, cooler spots of this radiation as you looked around a bit of the sky around the South Pole.
Now, this is not really good enough, because you want to see the whole sky, and you want to see it for a long time, longer than the flying time of a balloon. You cannot see the whole sky at the South Pole, simply because of where it is, and even if you waited and flew for a long time, it is not very good, because the Earth’s atmosphere over there is different to what it is over there, so you can only look at very close neighbouring points. So it was important to fly a satellite, and that is why a mission, led by Mather – and Smoot as another investigator – was conceived and flown by NASA, so for the first time, they were able to observe the whole sky over several years, and then there was a second mission, a few years ago, WMAP, which over the last three years has gradually been releasing more and more data.
I have a typical COBE and WMAP picture. This is the first picture of the sky at the level, say, of a milli-Calvin. The red bits are hot and the yellow bits are cold. If you increase the sensitivity of the detector and you look in a different waveband, you would see a microwave map of the sky. In the middle is the Milky Way, which is in the way, and there are sources there which also produce some microwave emission. So by making observations in different wavebands and then subtracting them, you can remove the Milky Way.
You then have a pure, all sky map, produced by satellite, a picture of the microwave fluctuation patterns in the universe. The COBE mission was the first non-zero detection of fluctuations in the microwave background in the universe. Previously, there had just been non-detections, so all you could say is that if there were fluctuations, they were smaller than this, smaller than a part of 1,000, smaller than a part in 10,000. You had to go to a sensitivity of 2 parts in 100,000 before you found them. If you had not found them then, it would start to become very embarrassing, because you can see the galaxies and clusters in the universe and their presence better be reflected in this radiation. Rather beautifully, it is reflected in exactly the level that you would expect.
After the first COBE mission, the next mission that flew had much greater sensitivity and that was the WMAP mission. Here is a representation of the map produced by WMAP – so you notice how finer the resolution is here, so there’s far greater sensitivity. What you want to do with this map is not just notice that there are fluctuations but produce a spec, a map of how the fluctuations vary with the scale, and also to look at the statistics of the fluctuation.
If you are a trained statistician and you look at this map, without doing any calculation, your first impression is that this is a Gaussian process. The reason you think that is because there are relatively few hot spots and cold spots, so you look at the extremes. One of the indicators of whether you are looking at something entirely non-random is if it has got many more extremes than you would otherwise expect. When you look in detail, the remarkable thing about the temperature map of the background radiation is that to detect level of detection, it is a pure Gaussian random process, so it is a purely random process. There is no special preference for fluctuations of a particular sort or in a particular direction, so, so far, it looks like a purely random statistical process with a particular type of variation with scale.
Wit the WMAP-3 observations, which were released rather recently, you get a feeling for how the resolution really improving. You see a finer and finer grained map on what the temperature variations look like. In a couple of years time, there will be another mission, launched by the European Space Agency, which will delve even more deeply and accurately into these fluctuations on the very, very smallest scales.
You are probably asking yourself why are people interested in these tiny fluctuations; why bother to keep flying more and more missions to look in more detail? This is not just a case of people wanting to look further and further at the same thing. There is a real reason to do that. There are people shooting at a very particular thing. We have also talked in past lectures about a key idea in modern cosmology and that is the idea of the inflationary universe.
I have a picture showing our whole visible universe today, which extends about 15 billion years round us in each direction, showing the greatest distance the light has had time to travel since the expansion began. But if we look in different directions, what we are saying is that we find the temperature around the sky at this radiation to be the same to one part in 100,000 accuracy.
We have been able to understand this in terms of a scenario in which the universe undergoes a brief interlude of accelerated expansion, very close to the beginning of its expansion, and that bout of acceleration is called inflation. Through all the rest of the time of the universe’s history, it decelerates, as gravity puts the brakes on and it slows down. What that acceleration enables you to do is to grow the whole of our visible universe from a region which is much, much smaller than it otherwise would be if the acceleration did not take place, and you can make it so small that at the time when it began accelerating there was time for light signals to pass around this region, for any irregularities and differences to be smoothed out and rendered purely statistical in size and character.
Because our whole universe is an expanded image of that little patch, which is co-ordinated and relatively smooth, that is why our universe is so smooth on the average and expands at the same rate in every direction. But, there must always be some tiny, statistical, quantum fluctuations in that little patch from which our universe has expanded in this theory, and if that is correct, we ought to be able to go out and see the expanded versions of those little fluctuations. They should show up in the microwave background maps and have a very, very particular form that is predicted by the theory. It was to test that prediction that these satellite missions were really designed.
A picture of the most recent accumulated results from these NASA missions shows the variation in temperature, the average level of it, so you could think of this as the changes in colour on the maps. You measure temperature in one place, and you measure it, say, one degree away, measure the difference, and then you do it for all one degree separations over the entire sky, and take the average.
The angular scale is put in degrees. The size of the Full Moon is about half a degree. So that is what that looks like on the sky, so at one level, you are looking at fluctuations the size of the Full Moon. Elsewhere, you are looking at bigger ones, or looking at much, much smaller ones. So the reason that you want to keep having missions that do better and better and are more and more accurate are so that you can see the smaller and smaller and smaller fluctuations.
You can see the red curve, which is the prediction of what should be seen if this type of inflationary bout of acceleration took place near the beginning of the universe, and the prediction is you should have a peak in the temperature on a particular scale of about one degree, and then the fluctuations die away, rather like the ringing of a bell. When they get very small, they are so small that they are just smoothed out in the past by friction and diffusion and they die away. So in a theory, where you have no inflation, you would not expect to see a peak at all. The fluctuations would just be flat.
What you are seeing is rather remarkable. The data points, in black, follow the predictive curve. They are seen not only in the first peak but the so-called second peak pretty unambiguously. There is growing evidence that when the sensitivity dies away that the third peak might be there. The locations of these peaks, their widths, their heights, tell you all sorts of things about how much matter there is in the universe, the details of inflation, and so on. In the microwave background is a wonderful catalogue of information about the structure of the universe through which the radiation is propagated and about the events which led to the possible inflation and early expansion of the universe.
There is one final thing that we would like to know about this radiation, and there is one last property that was predicted by Martin Rees long ago, I think in about 1968. He predicted that the radiation should be polarised. So if you have radiation and it undergoes scattering in some way, it will pick up a directionality. You can think of electromagnetic waves oscillating in two orthogonal directions as they propagate, and polarisation, if it is endowed on the radiation, you will produce a preference for one of those directions over the other. There are two sources of this type of polarisation that can be present. The first is called e-type and the second is called b-type; “e” is for electric and “b” is for magnetic.
The e-type is rather straightforward – it was the sort that Rees originally envisaged – that if locally the radiation is not perfectly isotropic, as it never is, then what will happen is that you will get a little bit of more scattering in one direction than another, and the scattering in the dominant direction will polarise the radiation in that direction. We can predict what we should expect the level of that type of polarisation to be, and it is basically about 10 times smaller than the “q” factor, the level of the temperature isotopy. So polarisation is 10 times harder to see, experimentally, than the temperature isotopy.
The other type, b-type, is expected to be 10 times smaller still, at best, and b-type is much more interesting. So b-type is not made by local directional scattering. It is created again by that process of inflation near the beginning of the universe, and if gravitational waves are produces, which I talked about in the last of my lectures, they can be produced at inflation with some level, if they are produced, then remember their effect, if they come through the stage here, they expand in this direction and they compress it in this direction, this process of expansion and compression, like a tidal force, endows a particular type of polarisation structure on the radiation. That structure of the b-type polarisation, if we could see it, would give us a direct look back to gravitational wave production at the time of inflation, and also evidence again for the existence of gravitational waves.
Well, recent WMAP satellite gave evidence, and there were also experiments on the ground that they did indeed see polarisation. I think there is no doubt they do see polarisation. The question is, is it really polarisation from the early stages of the universe or is it just produced by high energy particles in our galaxy? They have to subtract off the very large polarisation levels created locally and convince themselves that there is something left which cannot be explained by the local sources, but these sort of angular things are measures of the polarisation structure that they claim to see residually.
From the ground, already, we had other evidence of polarisation. I think people are fairly convinced that we see e-type polarisation, at the level that is expected, but we have no detection yet of the so-called b-type. In that mission that is planned for a couple of years’ time by the European Space Agency, one of the goals is to see that b-type polarisation. That is the next great discovery that is still to be made about the structure of the microwave background.
I hope I have given you some impression as to why the microwave background is important; why there have been four Nobel Prizes in Physics in the last 25 years for this area. It is the key Rosetta Stone about the universe. If you can unscramble the information in this radiation in the spectrum, in its temperature, in its isotropy and so on, you can learn what the universe is like in the past, how things occurred when the universe was just a fraction of a second old, what is the process that gives rise to galaxies, you have a way of measuring the age of the universe and the density of the universe that is much more accurate in its form than just looking directly at these things. So you will find that in astronomy the study of the microwave background will continue to dominate what we know about the history and large scale structure of the universe.
© Professor John Barrow, Gresham College, 14 December 2006
This event was on Thu, 14 Dec 2006

Support Gresham
Gresham College has offered an outstanding education to the public free of charge for over 400 years. Today, Gresham College plays an important role in fostering a love of learning and a greater understanding of ourselves and the world around us. Your donation will help to widen our reach and to broaden our audience, allowing more people to benefit from a high-quality education from some of the brightest minds.