Login
Login
Our 'Island Universe'

Share

- Details
- Text
- Audio
- Downloads
- Extra Reading
A lovely name for galaxies - if a little inaccurate. We will learn how the size and spiral structure of our own Milky Way has been determined, how it relates to others within our local group of galaxies and how the gravitational pull of groups and clusters has determined the large scale structure of the Universe.
Download Text
OUR 'ISLAND UNIVERSE'
Professor Ian Morison
The Milky Way
On a dark night with transparent skies, we can see a band of light across the sky that we call the Milky Way. (This comes from the Latin - Via Lactea.) The light comes from the myriads of stars packed so closely together that our eyes fail to resolve them into individual points of light. This is our view of our own galaxy, called the Milky Way Galaxy or often "the Galaxy" for short. It shows considerable structure due to obscuration by intervening dust clouds. The band of light is not uniform; the brightness and extent is greatest towards the constellation Sagittarius suggesting that in that direction we are looking towards the Galactic Centre. However, due to the dust, we are only able to see about one tenth of the way towards it. In the opposite direction in the sky the Milky Way is less apparent implying that we live out towards one side. Finally, the fact that we see a band of light tells us that the stars, gas and dust that make up the galaxy are in the form of a flat disc.
Figure 1 An all-sky view of the Milky Way.
The major visible constituent of the Galaxy, about 96%, is made up of stars, with the remaining 4% split between gas ~ 3% and dust ~ 1%. Here "visible" means that we can detect them by electromagnetic radiation; visible, infrared or radio. As we will discuss in detail in the next lecture, "The Invisible Universe", we suspect that there is a further component of the Galaxy that we cannot directly detect called "dark matter".
Figure 2 Cross Section of our galaxy.
Open Star Clusters
Amongst the general star background we can see close groupings of stars that are called clusters. These are of two types; open clusters and globular clusters. Open clusters are a consequence of the formation of a group of stars in a giant cloud of dust and gas and are thus naturally found along the plane of the Milky Way - the disc of our galaxy. Over time the stars will tend to drift apart but, whilst they are young, we will see the stars relatively closely packed together. Prime examples observable in the northern hemisphere are the Hyades and Pleiades clusters in Taurus and the Double Cluster in Perseus.
Figure 3: The Pleiades Open Cluster
Globular Clusters
The globular clusters are, in contrast, very old stars in tight spherical concentrations (~ 200 light-years across) of 20,000 to 1 million stars. In the northern hemisphere the most spectacular is M13 in Hercules, whilst Omega Centauri is a jewel of the southern hemisphere. They date from the origin of the Galaxy and were formed in the initial star formation period of our galaxy but their precise origin and role in the evolution of the galaxy is still unclear. Globular clusters orbit the centre of our galaxy and form a roughly spherical distribution helping to form what is known as the galactic halo. We know of 150 globular clusters associated with our Galaxy and perhaps a further 20 may be present but obscured by dust. Their spherical shape is due to the fact that they are very tightly bound by gravity, a further consequence of which is that the stars near their centers are very tightly packed.
Figure 4: M13, the globular cluster in Hercules
The interstellar medium and emission nebulae
Together the gas and dust make up what is called the interstellar medium or ISM. Most of the ISM is not apparent to our eyes but in some regions we can see either "emission nebulae" where the gas glows or "dark nebulae" where a dust cloud appears in silhouette against a bright region of the galaxy. Perhaps the most spectacular example of an emission nebula is the Great Nebula in Orion, or more simply the Orion Nebula - a region of star formation where the hydrogen gas is being excited by the ultraviolet light emitted by the very hot young stars - forming the "Trapezium" - at its heart. This type of emission nebula is called an HII ("H-two") region as it contains ionized hydrogen where the electrons have been split off from the protons by the ultraviolet photons emitted by very hot stars. The protons and electrons can then recombine to form neutral hydrogen atoms (HI - "H-one") and the electrons drop through the allowed energy levels to the lowest energy state emitting photons of various wavelengths as they do so. One of these transitions gives rise to a bright red emission line at 6563 Angstroms, so in photographs these regions look a lovely pinky-red colour.
Figure 5: The Orion Nebula, M42.
An example of a dark nebula is the "Coal Sack", seen against the background of the Milky Way close to the Southern Cross. Often the two types are seen together, as in the Eagle Nebula in Serpens and the Horsehead Nebula in Orion, where the dark pillars of dust and the "horse's head" respectively are seen against the bright glow of excited gas clouds.
Figure 6: The Eagle Nebula (left) and Horsehead Nebula (right).
Size, shape and structure of the Milky Way
The size of the galaxy was first measured by Harlow Shapley who measured the distances to 100 of the globular clusters associated with our galaxy. He found that they formed a spherical distribution, whose centre should logically be the centre of the galaxy, and so deduced that our Sun was ~30,000 light-years distant from it and the diameter was about 100,000 light years across. Figure 6 shows a cross section of the galaxy with the positions of the globular clusters observed by Harlow Shapley.
Figure 7: The distribution of globular clusters as observed by Harlow Shapley.
We now believe that the Sun is 27.7 light-years from the galactic centre and, using spectroscopic measurements to observe its motion relative to the globular clusters, we can calculate that the Sun is moving around the centre of the galaxy at about 230 km/sec, taking ~ 220 million years to travel once around it. It appears that the central parts of the galaxy rotate like a solid body so that the rotation speed increases as one moves out from the centre. Measurements of the speed at which stars and gas rotate around the centre of the galaxy as a function of distance produce what is called the "galactic rotation curve".
But what of its structure? Neutral hydrogen (HI) emits a radio spectral line with a wavelength of 21 cm. Radio observations of this line along the plane of the Milky Way show that the gas in the disc is not uniformly dense but is concentrated into clouds whose velocity away from or towards us can be determined using the Doppler shift in its observed wavelength. These data can be used to plot out the positions of the gas clouds and when this is done so a pattern of spiral arms emerges - indicating that we live in a typical spiral galaxy thought to be quite similar to the nearby Andromeda Galaxy.
Observations of the Hydrogen Line
Let us consider this in more detail. A neutral hydrogen atom consists of a proton and an electron. As well as their motion in orbit around each other, the proton and electron also have a property called spin. This is actually a quantum mechanical concept, but is analogous to the spin of the Earth and the Sun about their rotation axes. Again using this analogy, the spin may be clockwise or anticlockwise. Thus their two spins may be oriented in either the same direction or in opposite directions. In a magnetic field (as exists in the galaxy) the state in which the spins of the electron and proton are aligned in the same direction has slightly more energy than one where the spins of the electron and proton are in opposite directions. Very rarely (with a probability of 2.9×10⁻¹⁵ s-1) a single isolated atom of neutral hydrogen will undergo a transition between the two states and emit a radio spectral line at a frequency of 1420.40575 MHz. This frequency has a wavelength of ~ 21 cm so that it is often called the 21-cm line. A single hydrogen atom will only make such a transition in a timescale of order 10 million years but, as there are a very large number of neutral hydrogen atoms in the interstellar medium, it can be easily observed by radio telescopes. This radio spectral line was first detected by Professor Edward Purcell and his graduate student, Harold Ewen, at Harvard University in 1951 using a simple horn antenna.
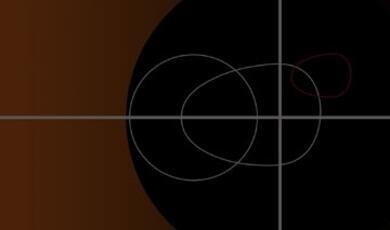
Let us consider what we would see if out Galaxy had a number of spiral arms. As well as delineating concentrations of stars and dust, they will also contain a higher concentration of hydrogen gas. As all the material in the galaxy is rotating around its centre, when we look in different directions along the galactic plane the material in the spiral arms - in some directions we might see several - will have differing velocities away from or towards us. The hydrogen line from these different arms will thus be Doppler shifted to higher or lower frequencies. Due to motion of the gas within an element of an arm that we observe, any given arm will give a line profile that is approximately a Gaussian as shown in (a) of figure 8. This shows the gas close to us in our local spiral arm so its average velocity relative to us is zero. If the beam of our radio telescope receives radiation from the hydrogen gas in a spiral arm coming towards us we will see that Gaussian profile shifted to higher frequencies as in (b), whilst if moving away we will observe it at lower frequencies as in (c). In general, should we look in some arbitrary direction we may observe several arms and so get a more complex profile as shown in (d) which can be "dissected" into the individual profiles from each arm as shown in (e).
Figure 8: Hydrogen Line profiles.
Figure 9 shows some hydrogen line profiles observed using a 6.4 metre radio telescope at the Jodrell Bank Observatory. Each has the galactic latitude at which it was observed; latitude 0 would mean that our telescope would be pointing directly at the centre of the galaxy, latitude 180 directly away from it - looking out from our galaxy. You can see that in this latter direction, there is only one peak in the spectrum which is centered on zero velocity with respect to us. This is the hydrogen in our local spiral arm which is all that we observe in this direction and is, of course, at rest with us. As we lie within our spiral arm there will always be a peak at zero relative velocity but, as we look along the Milky Way in other directions, we see other peaks in the spectrum, corresponding to other spiral arms. For example, at L= 90 we see three other spiral arms.
Figure 9: Galactic Hydrogen Line profiles.
By observing such hydrogen line profiles along the galactic plane, and using a model of the rotation curve of the galaxy, it is possible to locate the position of each observed arm along the line of sight through the galaxy and build up a picture of the spiral structure of our own galaxy. Figure 10 shows a section of the plane of the Milky Way with vertical relief showing the brightness of hydrogen. The local arm appears like a range of mountains on the right of the plot, with the Perseus arm curving out to its left. The more distant outer arm can just be seen appearing like "foothills" even farther to the left.
Figure 10: A relief map of a section of the Milky Way obtained with the 6.4 metre radio telescope at Jodrell Bank Observatory.
The fact that our galaxy has spiral structure is somewhat of a puzzle. In its life, our Sun has circled the galactic centre about 20 times so why haven't the spiral arms wound up? The solution is hinted at by a visual clue. Spiral arms seen in other galaxies stand out because they contain many bright blue stars - remember a single very hot star can outshine 50,000 suns like ours! But very hot bright stars must be young as they have very short lives, so the spiral structure we see now is not that which would have been observed in the past. As B. Lindblad first suggested, it appears that the spiral arms are transitory and causes by a spiral density wave rotating round the galactic centre - a ripple that sweeps around the galaxy moving through the dust and gas. This compresses the gas as it passes and can trigger the collapse of gas clouds so forming the massive blue stars that delineate the spiral arms. The young blue stars show us where the density wave has just passed through but in its wake will be left myriads of longer lived (and less bright) stars that form a more uniform disc.
Figure 11: The spiral structure of our galaxy as shown by observations of the Hydrogen Line.
A Super-massive Black Hole at the Heart of our Galaxy
Whereas at optical wavelengths the centre of our galaxy is obscured by dust, at radio wavelengths we are able to peer deep into its heart and astronomers have discovered a very compact radio source called Sgr A* in the constellation Sagittarius which we believe marks the position of a super-massive black-hole at the centre of our galaxy. How can we be sure that this exists? In the same way that one can calculate the mass of the Sun by knowledge of the orbital velocity of the earth and its distance from the Sun, we can estimate the mass of Sgr A* by measuring the speeds of stars in orbit around it at very close distances. For example, one of the 8-m VLT telescopes at Paranal Observatory in Chile has observed a star in the infra-red as it passed just 17 light hours from the centre of the Milky Way (three times the distance of Pluto from the Sun). This convincingly showed that it was under the gravitational influence of an object that had an enormous gravitational field yet must be extremely compact - a super-massive black hole. Its mass is now thought to lie between 3.2 and 4 million solar masses confined within a volume one tenth the size of the Earth's orbit.
Our place in the Universe
The Cosmic Distance scale
To understand the scale size of the universe we need to be able to measure the distances of the galaxies. A key reference point in the "distance ladder" are the distances to the Large and Small Magellanic Clouds, two nearby irregular galaxies. These are visible to the lower left of the centre of the Milky Way in Figure 1. As we will see, a type of very bright variable star observed within them, the Cepheid Variables, can be used as a "standard candle" to measure the distances of galaxies relative to the distances of the Magellanic Clouds. For this to be possible, we must first have an accurate measure of the distances of one or other of the Magellanic Clouds.
Estimating the precise distances to the LMC and SMC has not been easy, with values varying substantially over the years. With the occurrence of SN 1987A in the LMC, astronomers were given a direct method to measure the distance to the LMC. This was based on the time taken for the light emitted by the supernova to illuminate a distant ring of gas surrounding it. These important observations and the calculations based on them have resulted in an estimate of the distance from Earth to the centre of the LMC of 52.0 ± 1.3 kpc. This, together with other observations that are in agreement, has helped define a new value for the zero point of the Cepheid distance scale, and has greatly improved our knowledge of galactic distances.
The Cepheid Variable Distance Scale
The observational basis of this distance scale was provided byHenrietta Leavitt whilst working at the Harvard College Observatory where she became head of the photographic photometry department. In the early years of the 20th century, her group studied images of stars to determine their magnitude using a photographic measurement system developed by Miss Leavitt that covered a 17 magnitude brightness range. Many of the plates measured by Leavitt were taken at Harvard Observatory's southern station in Arequipa, Peru from which the Magellanic Clouds could be observed and she spent much time searching the plates taken there for variable stars within them. She discovered many variable stars within them including 25 Cepheid variable stars. These stars are amongst some of the brightest; between 1000 and 10,000 times that of our Sun and are named after the star Delta Cephei which was discovered to be variable by the British astronomer John Goodricke in 1784. These stars pulsate regularly rising rapidly to a peak brightness and falling more slowly as shown in figure 12. Leavitt determined the periods of 25 Cepheid variables in the SMC and in 1912 announced what has since become known as the famous Period-Luminosity relation. She stated: "A straight line can be readily drawn among each of the two series of points corresponding to maxima and minima (of the brightness of Cepheid variables), thus showing that there is a simple relation between the brightness of the variable and their periods." As the SMC was at some considerable distance from Earth and was relatively small, Leavitt also realized that: "as the variables are probably nearly the same distance from the Earth, their periods are apparently associated with their actual emission of light, as determined by their mass, density, and surface brightness."
Figure12: A Cepheid Variable light curve and period-luminosity relation.
The relationship between a Cepheid variable's luminosity and period is quite precise, and a three-day period Cepheid corresponds to a luminosity of about 800 times the Sun whilst a thirty-day period Cepheid is 10,000 times as bright as the Sun. To give an example; we might measure the period of a Cepheid variable in a distant galaxy and observe that it is 1000 times fainter than a Cepheid variable in the LMC. We can thus deduce that, from the inverse square law, it would be 100 times further away than the LMC, that is 100 x 51.2 Kpc giving a distance of 5,100 Kpc (16,600 Ly). Cepheid stars are thus the ideal standard candle to measure the distance of clusters and external galaxies. (As we do not know the precise location of the Cepheid variable within the cluster or galaxy there will be a small uncertainty but this error is typically small enough to be irrelevant.)
Edwin Hubble, whose famous work based on his measurements of the distances of galaxies is discussed in the next chapter, identified some Cepheid variables in the Andromeda galaxy, proving for the first time its extragalactic nature. Until this time some astronomers had argued that the so called "white nebulae" were within our own Milky Way galaxy
Groups and clusters of galaxies
Most galaxies are found in groups typically containing a few tens of galaxies or clusters that may contain up to several thousand. Our Milky Way galaxy forms part of the Local Group that contains around 40 galaxies within a volume of space three million light-years across. Our galaxy is one of the three spiral galaxies (along with M31 and M33) that dominate the group and contain the majority of its mass. M31, the Andromeda Galaxy, shown in figure 13, and our own are comparable in size and mass and their mutual gravitational attraction is bringing them towards each other so that, in a few billion years, they will merge to form an elliptical galaxy. M33, whose mass we calculated earlier, is the third largest galaxy in the group. The group also contains many dwarf elliptical galaxies, such as the two orbiting M31 and visible in figure 13. M32 is a small, type E2, elliptical galaxy seen to the left of nucleus of M31, just outside its spiral arms, whilst NGC 205 (M110) is a more elongated, type E5 or E6, elliptical that is seen to the lower left of the nucleus of M31. The Local Group contains several large irregular galaxies, such as the Magellanic Clouds, and at least 10 dwarf irregulars to add to the total. There may well be more galaxies within the group, hidden beyond the Milky Way that obscures over 20% of the heavens.
Figure 13: M31, the Andromeda Galaxy, along with two dwarf elliptical galaxies, M32 and NGC 205.
Observations of the region lying in Virgo just to the west of Leo show many hundreds galaxies and is thus called "the realm of the Galaxies". Sixteen of these are bright enough to have been catalogued by Charles Messier using a telescope of just a few inches aperture. In this direction we are looking towards the heart of a galaxy cluster containing some 2000 members called, due the constellation in which we observe it, the Virgo Cluster. Two other nearby clusters are the Coma Cluster and the Hercules cluster. Galaxy clusters typically contain 50 to 1000 galaxies within diameters of 6 to 35 million light years and having total masses of 1014 to 1015 solar masses.
Figure 14: The Virgo Cluster of galaxies.
Superclusters
Small clusters and groups of galaxies appear to make up structures on an even larger scale. Known as superclusters, they have overall sizes of order 300 million light-years (100 times the scale size of our local group). Usually a supercluster is dominated by one very rich cluster surrounded by a number of smaller groups. The Local Supercluster is dominated by the Virgo Cluster. The Virgo supercluster, as it is often called, is in the form of a flattened ellipse about 150 million light-years in extent with the Virgo Cluster at its centre and our local group near one end. In the same general direction, but further away lies the Coma cluster containing over 1000 galaxies. It is the dominant cluster in the Coma Supercluster at a distance of 330 million light-years. Two other nearby superclusters lie in the directions of the constellations Perseus/Pisces and Hydra/Centaurus at distance of 150 and 230 million light-years respectively.
These very great distances are beyond that where the Cepheid variable distance scale can be used. In the final chapter we will see how relatively recent observations of Type Ia supernova are being used to measure distances of this magnitude. However it is worth mentioning a very simple method that had been used prior to this new technique. One could reasonably assume that the largest galaxies within a cluster are probably of the same size. One might take the third largest to avoid the possibility that the largest might be more extreme than in most clusters. If their sizes are measured on a photographic plate then one can compare them to a galaxy, hoped to be similar is size, whose distance we do know. In a similar vein, one could take the magnitude of the galaxy and use that estimate its distance.
Figure 15: The Hubble Ultra Deep Field.
The most distant galaxies ever observed are shown in the Hubble Ultra Deep Field shown in figure 15. Some are observed at a time just 0.7 billion years after the origin of the universe, just 5% of its present age. -
The overall structure of the Universe is like a sponge with regions that are virtually empty - we call them voids - surrounded by the clusters and superclusters of galaxies. The three dimensional pattern is called the Cosmic Web. It results from the effects of gravity acting on very small fluctuations in initial density of the universe which are caused by the clumping of dark matter - as will be discussed in the next lecture. Those regions that were slightly denser attract material to them from the less dense regions - which thus become emptier and result in the voids that we see. The concentrations of matter around the voids then give rise to the clusters and superclusters of galaxies as shown in figure 16.
Figure 16: The Cosmic Web
Professor Ian Morison, Gresham College, 30 October 2008
This event was on Thu, 30 Oct 2008

Support Gresham
Gresham College has offered an outstanding education to the public free of charge for over 400 years. Today, Gresham College plays an important role in fostering a love of learning and a greater understanding of ourselves and the world around us. Your donation will help to widen our reach and to broaden our audience, allowing more people to benefit from a high-quality education from some of the brightest minds.