Login
Login
Scratching the Surface? Looking from Space at Human Impact on Earth

Share

- Details
- Text
- Audio
- Downloads
- Extra Reading
Recent developments in space technology have allowed us to view the Earth in new ways, and to identify our impact on land, atmosphere, oceans and freshwater in astonishing detail. Our planet’s fragility as a life support system is being revealed today in ways that would not have been anticipated even twenty years ago.
The lecture will explore some of the science behind these observations, show a range of the curious and beautiful imagery being generated, and ask questions about the opportunities and risks of this type of environmental surveillance.
Download Text

13 October 2016
Scratching the Surface?
Looking from Space at Human Impact on Earth
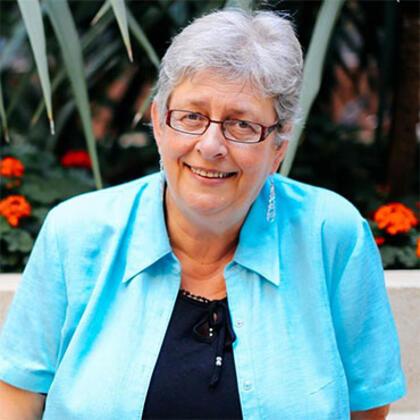
Professor Carolyn Roberts
Good evening, Ladies and Gentlemen, and welcome to the first of my 2016-17 series of environmental lectures. This year I will be exploring the theme ‘A Bigger Picture’, looking at some of the global scale challenges that face us, how we may think about the scope of these problems, and what would need to be done to take ameliorative action. As in previous years, I am most grateful to the Frank Jackson Foundation for supporting my Professorship. For those of you who are unaware, the Frank Jackson Foundation funds research in world leading institutions, and community initiatives internationally, reflecting the interests of Mr Frank Jackson who was a businessman from Woodbridge in Suffolk.
Today, I will be setting the scene by exploring one of the most rapidly developing areas of science that supports our understanding of planetary-scale environmental processes – Earth observation from satellites. I hope to take you on a journey from some of the early observations through to current cutting edge science and to reflect on the opportunities and challenges for environmental science afforded by this type of analysis.
Back in 1972, this was one of the images that provided a genuinely new perspective on the Earth. It was not the first space-based Earth image, but it caught on. Taken in December by the Apollo 17 crew as they travelled towards the moon, it is an image taken by a hand held camera pointed through the space ship window. You can see the whole of the Earth, the South Polar ice cap, a lot of cloud in the southern hemisphere, and all of Africa, the so-called ‘Blue Marble’. The Earth appears as an isolated and fragile floating ecosystem, and despite the perilous journey of the astronauts, it served to demonstrate that the Earth’s population were trapped on ‘one world’, with no emergency escape hatch. It provided a nice complement to the United Nations Stockholm conference on the Human Environment that had taken place in June the same year, which had issued the Declaration of the United Nations Conference on the Human Environment. They had expressed the need for ‘a common outlook and for common principles to inspire and guide the peoples of the world in the preservation and enhancement of the human environment’. There was a resonance, since there were no visible borders.
Over thirty years later, in 2005, NASA issued further cloud free images of the east and west hemispheres of the Earth, at what was then an amazing resolution (half a kilometre per pixel or dot), called ‘The Blue Marble: The Next Generation’. Most people might not even have noticed the difference from the 1972 picture, but these were actually made up of thousands of satellite images whose pixels were radioed back from space at different times, selected or rejected and artificially stitched together, rather than being a single instantaneous shot. In 2012, there was a third set called ‘Blue Marble Next Generation 2012’ assembled from data collected by NASA’s Suomi NPP satellite over the course of a few months. Neither of these two later ‘Blue Marbles’ are anything that an actual observer could in reality ‘see’, because they consist of many precisely-located cloud-free images, digitally wrapped around an imaginary spherical wire frame. They can also be altered or updated at any time, without us knowing, and are virtual or unreal artefacts as Laura Kurgan’s recent book ‘Close up at a Distance’ calls them. This distinction between what environmental elements we might in theory see with our eyes (given the right vantage point), and what we can ‘see’ using satellite imagery, is a theme to which I will return later.
More recently again, images from NASA’s DSCOVR satellite, sitting at the unique gravity-neutral Lagrange point 1 a million miles away between the Earth and the sun, show us a sequence of a year’s cloud patterns on the sunlit side of the Earth, one taken every two hours by a 4 megapixel-capability camera. This represents an astonishing shift in our ability to navigate around and represent the Earth’s surface. DSCOVR's orbit gives Earth scientists a unique vantage point for studies of the atmosphere and climate, allowing measurement of ozone and dust, cloud heights, vegetation properties, hotspot land properties and UV radiation estimates at the Earth's surface. We will come back to how this is done later.
Let’s go back a bit. Satellite imaging first emerged in the 1960s, as a military intelligence tool. Tiros-1 was the first device put up by the Americans in April during the Cold War, but dedicated to imaging cloud patterns across the globe. The USSR was not far behind, of course. Satellites were needed to check the weather, identify appropriate military targets around the globe, and to manage missiles in flight. The US Corona satellite, for example, collected high resolution images for military purposes that were classified until the mid-noughties, when they were released by the then US Vice President Al Gore. Targets, mainly. Then in 1972, Landsat-1 started to generate the first publicly-available low resolution images of the Earth’s surface every three days. Landsat-1 effectively swung across the Earth’s surface in a low, polar orbit whilst the planet twirled underneath it, and was the first in a series of Landsats of increasing sophistication. The revolution in Earth Observation was under way.
The subsequent progression of earth imaging for environmental and other ostensibly benign purposes was enabled by the increasing sophistication of a number of technologies, in addition to the obvious rocketry for getting them up into orbit:
The operationalisation of Global Positioning Satellites (GPS) for military and civilian uses in 1991, including huge improvements in the timing precision afforded by atomic clocks
The opportunity for distributing data and imagery on the WWW from the 1990s
The explosion in desk top computing
The use of Geographic Information Systems for managing information
The privatisation of high resolution satellites later in the 1990s
Massive international growth in data storage capability, and decrease in costs
Google Earth, I think, is of particular significance as a democratizing influence. It has allowed almost anyone to explore the world. Google Earth was the product of private corporation Google, who produced an application that brought together not only a miscellaneous mosaic of contemporary satellite imagery, but also now offers the possibility of rolling back the clock to look at earlier airborne images. Launched only fifteen years ago in 2005 as Earth Viewer 3D, Google Earth’s predecessor was initially developed for the American CIA, but has probably been downloaded at least a couple of billion times. I wonder if there is anyone here who has not zoomed in on their house and garden? Anyone with an internet link has access – a democratic technology. What we are offered is images of varying resolution, such as this one of the City, central London, but also 3D views, and 3D close ups in ‘Street View’ that were produced from ground shots taken from roving vehicles, and linked to the satellite image. Most of the Earth’s land surface is covered at a resolution of about 15 metres, but some parts of the UK (Cambridge, for example) are now visible at the highest resolution, about fifteen centimetres. In order to get 3D coverage of most of the Earth, NASA used radar tomography from a shuttle, and merged this with the Landsat imagery. The most recent versions of Google Earth offer an astonishing range of functions from 3D undersea bathymetry images using data collected from research vessels (at 100m resolution for the areas that have been covered), to flight simulators where you can fly around the landscape in a particular type of aircraft, as well as the historical imagery that I noted before. Here we see the post-World War II area of Barnard’s Inn Hall, for example. Typical images such as these colourful ones from the Netherlands look like photographs, and as we know there is the ability to zoom in, apparently seamlessly, until we are sure of what we are looking at – tulip fields in this case.
Today there are about 150 Earth Observation satellites radioing their data back to Earth. Here are only a few of them, indicating which nations, despite the expense, prioritise the technology. India, Russia, Japan, China, France, Brazil, Argentina, Nigeria and Korea are strong supporters of satellite imaging. The UK is currently part of various European consortia. South Korea has a particularly good system, and of course the drivers for such developments continue to be military in part. Ostensibly, South Korea’s satellites are supporting disaster relief, but no doubt the areas across the border with North Korea attract close scrutiny.
These pieces of advanced space technology (‘flying dustbins’) sit in one of several orbits, either geostationary high above the earth’s equator like most of the meteorological satellites, or alternatively, as in the case of Landsat, they swing around the planet in a lower orbit, giving a close view every time they hurtle overhead. It is perhaps worth saying that the spy movie satellites that can instantaneously follow running figures exist, at least as far as I know, only in the realms of fantasy. Even if they have solar panels, satellites have to carry fuel to keep themselves in orbit, occasionally firing off tiny bursts to stop the friction from the Earth’s atmosphere pulling them towards the ground. There is little to waste on moving and pointing at particular areas – the best that can be done is to switch the sensors on and off as they pass over a particular area.
If for the moment we just consider images that appear as we would see the ground, in ‘true’ colour, there are very arresting scenes. Here for instance is a stunningly beautiful image of an otherwise very inaccessible area – the Chapman Glacier in Antarctica, with its feeder ice caps, its lines of moraine, its temporary lakes and the underlying bedrock. An apparently pristine environment, untouched by human activity. By contrast, this 70 acre area of Colorado, Elitch Gardens Theme Park, is fantasy landscape, created and maintained for fun. Much less fun, but no less a human artefact, the Zaatari refugee camp in Jordan offers a salutary glimpse at an otherwise unfamiliar (to those safely here in the UK) place. The sharpness of the boundary separating those who are local from those 80,000 Syrians who are migrant, and the contrast between the regimented and densely packed camp huts, and the more organic and chaotic patterns in the surrounding agricultural areas (also intensive) are stark. It is apparently now the fourth largest city in Jordan, and at one point in 2013 housed 200,000 people. The environmental aspects of this are also, I think, fairly clear; the brightness of the image reflects the complete absence of vegetation inside the walls. There are also ‘true colour’ night time shots such as these of the USA and India, showing visible lights – light pollution, some might say – and reflecting the huge impact of human activity on what would otherwise have been a completely dark image.
There are too some pretty funny things to be seen – here are a few examples…..giant man, giant bunnies, and giant crabs threatening Whitstable.
Earth observation today focuses on many different themes – weather and climate, agriculture, ecosystems and biodiversity, energy, water, and disaster management being some of them. For simplicity, and tongue in cheek, I have grouped just a few images into the ancient alchemical clusters of earth, air, fire and water. In each case, I ask you to think about the extent of any human influence evident in the image, and how such images might assist us to manage the environment, or cope with some emerging disaster. In our ‘earthly’ group, are striking landscapes such as Iceland’s Vatnajokull ice cap, covering some 8% of the land area and containing the largest volume of ice in Europe. Google Earth allows us to take a synoptic view of the ice and immediately have an impression of how the environment functions, with ice oozing like a blob of toothpaste across the land surface, releasing water and sediment into the sea without any impression of human activity. At the other end of the ‘earthly’ climatic spectrum, the Grand Erg Oriental in Algeria, the Great Sand Sea of the Sahara, shows amazing wind-blown patterns of star dune development, at a scale and regularity almost incomprehensible for scientists until the widespread access to this means of imaging. No human influence is apparent. By contrast, the images of Homestake Gold Mine, in South Dakota, at one time the largest and deepest gold mine in the USA, and N’Djamena, the capital of Chad in central Africa, show a human inheritance.
These images can be linked through time. Half way between earth and water, the Dutch Ijsselmeer, a former North Sea inlet surrounded by land hauled out of the swamps of the Rhine delta, is maintained only by complex arrangements of pumps and sluices. The recent progression of this reclamation, particularly in the south at Markermeer, stalled as a result of shifts in public opinion towards favouring more natural approaches to environmental management. It is now a shallow lake, whereas it was formerly intended to be agricultural land.
Before we move on to the ‘airy’ images, I want to introduce a new aspect to remotely sensed imagery. So far, most of the images that we have looked at have been ‘true’ colour images. They look like the standard photographs that our cameras would take – like these images of one of the Egyptian pyramids, albeit at different resolutions. But just as these digital images are made up of many separate images draped over a spherical ‘wire frame’, and possibly imaged at different times, these images are also made up of digital signals that come from different parts of the electromagnetic spectrum. The electromagnetic spectrum is too complex a subject for a single lecture, but suffice it to say that the visible (to humans) parts of the spectrum are only a tiny part of the whole, which ranges from health-damaging gamma rays and X-rays, through the rainbow of the visible spectrum, to infra-red, microwaves and radio waves. Different areas of the spectrum, or bands, are classified according to their wavelength. The sun’s radiation includes many different wavelengths, and when it falls on the earth’s surface, some wavelengths are preferentially reflected and some absorbed dependent upon the characteristics of the surface. If they are absorbed, the energy may then be reradiated, but at different wavelengths. Satellite sensors are designed to capture particular wavelengths, in different parts of the spectrum.
The black and white image of a former research area of mine on the edge of the Sahara is actually an image of infrared radiation – the bright areas are where the sensor detects a lot of infrared radiation, and the dark areas show where there is less. The defining characteristic here is the presence of water, because water absorbs infrared radiation very effectively, leaving little to be reflected. If an image is made up by combining signals in each of three visible bands (yellow, magenta and cyan, like printer cartridges), and each one is displayed in its original colour, then we end up with a ‘true colour’ image like the Google Earth ones. But we can combine different bands, say two visible bands and one infrared, and end up with some form of ‘false colour’ image. A common convention is to display the infrared band in red, but reversing the display so that bright red areas show where there is water, and vegetation containing water. It is much easier to see than moisture in soil in a ‘true colour’ image. With minor variations (and some systems actively generate electromagnetic radiation themselves and detect and record its reflection – RADAR is the example everyone will know, but microwaves use the same principle). For different types of surfaces, we can select the spectral bands we observe and use, and the way we display them, mixing and matching until we get the image we really want, that highlights the things in which we are most interested. Here’s the Nile Delta in ‘true colour’ and here in ‘false colour infrared’; the rivers are not running red, the image is just the result of the way we select the electromagnetic bands we use, and display them. This high resolution infrared image of pivot irrigation in Saudi Arabia is eye-catching too.
Here are some images of land areas with different bands included, displayed in different colour configurations, tweaked to highlight particular themes. The San Andreas fault and the different crops appear on the first, and the second one is an area of the UK, showing (in purple on the image) increasing patterns of some crop in the Midlands.
‘Airy’ images, at all scales, are also very familiar to us from UK and international weather forecasts. The main advantage of this type of imagery is the frequency of repetition of the coverage, and the ability to see immediately what is happening to moving clouds at different scales, in real time. Typhoons provide some of the most eye-catching images, shown here for Taiwan, and our forecasting ability has improved dramatically since the introduction of new systems. Here is the cloud associated with Hurricane Matthew, last week, twirling around off the coast of Florida, and recorded and displayed almost in real time. The volumes of data now being handled are extraordinary to some of us. On a slightly different theme, but drawing on the same principles, it is now possible to use specific bands of the spectrum to identify and track cloud top temperatures, and dust plumes arising from the Sahara, as in these images, and carbon dioxide concentrations in the atmosphere.
Fire on Earth comes in several forms. The display of true colour imagery in real time, such as these of Soberanes forest fires in California, has obvious environmental applications. Fires are an essential part of semi-arid environment ecosystems, but when people live close by, they become problematic. The direction of the smoke can be tracked and the spatial resolution is now so good in some satellites that new fire origins can be identified before they become established.
It is also possible to track the ash plumes from volcanoes, an obvious hazard to aeroplanes, in near-real-time, as this work on the Kelut Volcano, Indonesia by colleagues at Oxford University has demonstrated. More challenging is the use to follow sulphur dioxide that is also emitted, and which is not only toxic, but the sulphur is an important component of global ecosystems. That requires some observations of actual gas contents to be snatched from the plume, so as to calibrate what the satellite images are showing, but after that has happened once, repeat events may be able to use the previous calibrations. We are starting to understand global scale environmental systems in part as a result of this work. Of course there are other natural ‘fires’ too, and occasionally satellites capture the beautiful aurora borealis across northern or southern latitudes.
I talked briefly about water before, but I want to conclude here by showing a few images of watery scenes, from the simple ‘true colour’ of fossil river meanders amongst agricultural areas, through to the saline waters of the Dead Sea (which we can also capture by monitoring different wavebands), the shrinking of the Aral Sea (with a complex key relating to salinity and water presence at different times) and the break-up of icebergs in Antarctica (with a resolution now of 0.5M). We can also monitor chlorophyll in the Baltic Sea, and water temperatures (here shown in Lake Michigan). Environmental science has really benefitted.
Things are realising such potential now, with the resolution and the improvements in timing and locations, that not only can see wildebeest migration in Kenya, and individual ships, but that we may be able to spot illegal fishing in real time. That innovative possibility, and monitoring marine reserves, is just being explored today by a company in the UK. Satellite imaging is improving its resolution, its available bands, its frequency and its costs all the time, and there is no doubt that this is the greatest influence on environmental science of the last couple of decades. The diagram shows some of the systems we have now, with their costs and potentials, and it is obvious that the potential has only just started to be realised.
These environmental applications are all apparently very positive, and surveillance is unearthing information about all types of environmental subjects from soil erosion to plant disease spread, fertiliser applications, to climate change. But of course we are left with some issues about who is looking at what, why, and how the images are represented? At what point does monitoring illegal fishing, or cows being taken backwards and forwards across the Irish borders to claim various subsidies, become an infringement of liberties? Google Earth, in particular, has not been without its critics. Military bases are clear to everyone – there are some here. There have been allegations about invasions of privacy, and threats to national security because information about sensitive military or critical installations (reservoirs, or listening posts, for example) is readily accessible to potential terrorists. India, for example, has expressed concern about the availability of high resolution images of sensitive locations, and Google subsequently censored them. Israel has protested about the availability of images of air force bases, the HQ of Mossad, and nuclear research centres. It is claimed that people examining images of China spotted a very large scale replica of the Karakorum Mountains, intermittently claimed by India. Google Earth has been blocked in Iran, the Sudan and Morocco. Naively, I used to wonder why the images of Cheltenham used not to be of such good quality as one might have expected. Fighting back, Google Earth used to have Area 51, a highly visible and easy to find defence establishment in Nevada, as a default placemark when Google Earth is first loaded onto a computer; Area 41 was a classified US military installation for many years.
In the UK, critics have argued that Google Earth is an invasion of people’s right to enjoy their own property without being observed, but that is an evolving point; the state’s right to secrecy and the individual’s right to privacy are highly contested issues. Here you can see a lad in Edinburgh giving his view of the Google Earth camera system as it travelled around the city photographing images for the 3D view that is linked to the satellite images. The 2006 addition of a large image of male anatomy to the roof at Yarm School, an independent establishment in Stockton-on-Tees, might tell a similar story of protest about infringements of personal privacy, as it was clearly visible on Google Earth – though perhaps the perpetrators were more interested in raising their profile than the issue of privacy… it has since been removed.
There are also issues relating to the use to which the images are put, and concern about creeping totalitarianism, perhaps even more particularly now much of the image processing capability is in the private sector. Environmental police could put some of this imagery to uses that we have not yet begun to imagine. I will, nevertheless, leave you with a benign image, that even ten years ago would not have been possible. The Kenyan wildebeest.
Thank you.
© Professor Carolyn Roberts, 2016
This event was on Thu, 13 Oct 2016
Support Gresham
Gresham College has offered an outstanding education to the public free of charge for over 400 years. Today, Gresham College plays an important role in fostering a love of learning and a greater understanding of ourselves and the world around us. Your donation will help to widen our reach and to broaden our audience, allowing more people to benefit from a high-quality education from some of the brightest minds.